Business
One Chart Sums Up Oil’s Week, Latest Oil ETF Move Called “Garbage”

The financial markets were roiled on Monday when what once seemed impossible happened. For the first time in history, the price of oil fell below zero.
And not just a little below zero, but a negative $37.63 per barrel. It was only the May futures contracts that expired the very next day (Tuesday) that fell below zero. However, it literally meant that if you were willing to take physical delivery of a barrel of oil in Cushing, Oklahoma, the producer would pay you $37.63 to take the oil off their hands.
It’s the most extreme indicator yet of the ongoing troubles in the oil patch. Also, unfortunately for producers, there doesn’t seem to be a quick fix in sight. Demand has collapsed by an estimated 29 million barrels per day in April. Without that daily drawdown, supplies are on the verge of overrunning every storage facility available.
Producers Store Oil
Producers and refiners here in the US are resorting to storing oil in railcars and unused pipelines. Meanwhile, in Europe, salt caverns in Sweden and other Scandanavian countries are either full already or have been booked.
The oversupply has already started to affect the price of the June futures contract. The price down to roughly $14 per barrel. This is the lowest price an oil contract has been with this much time remaining to its expiration date since the late ‘90s.
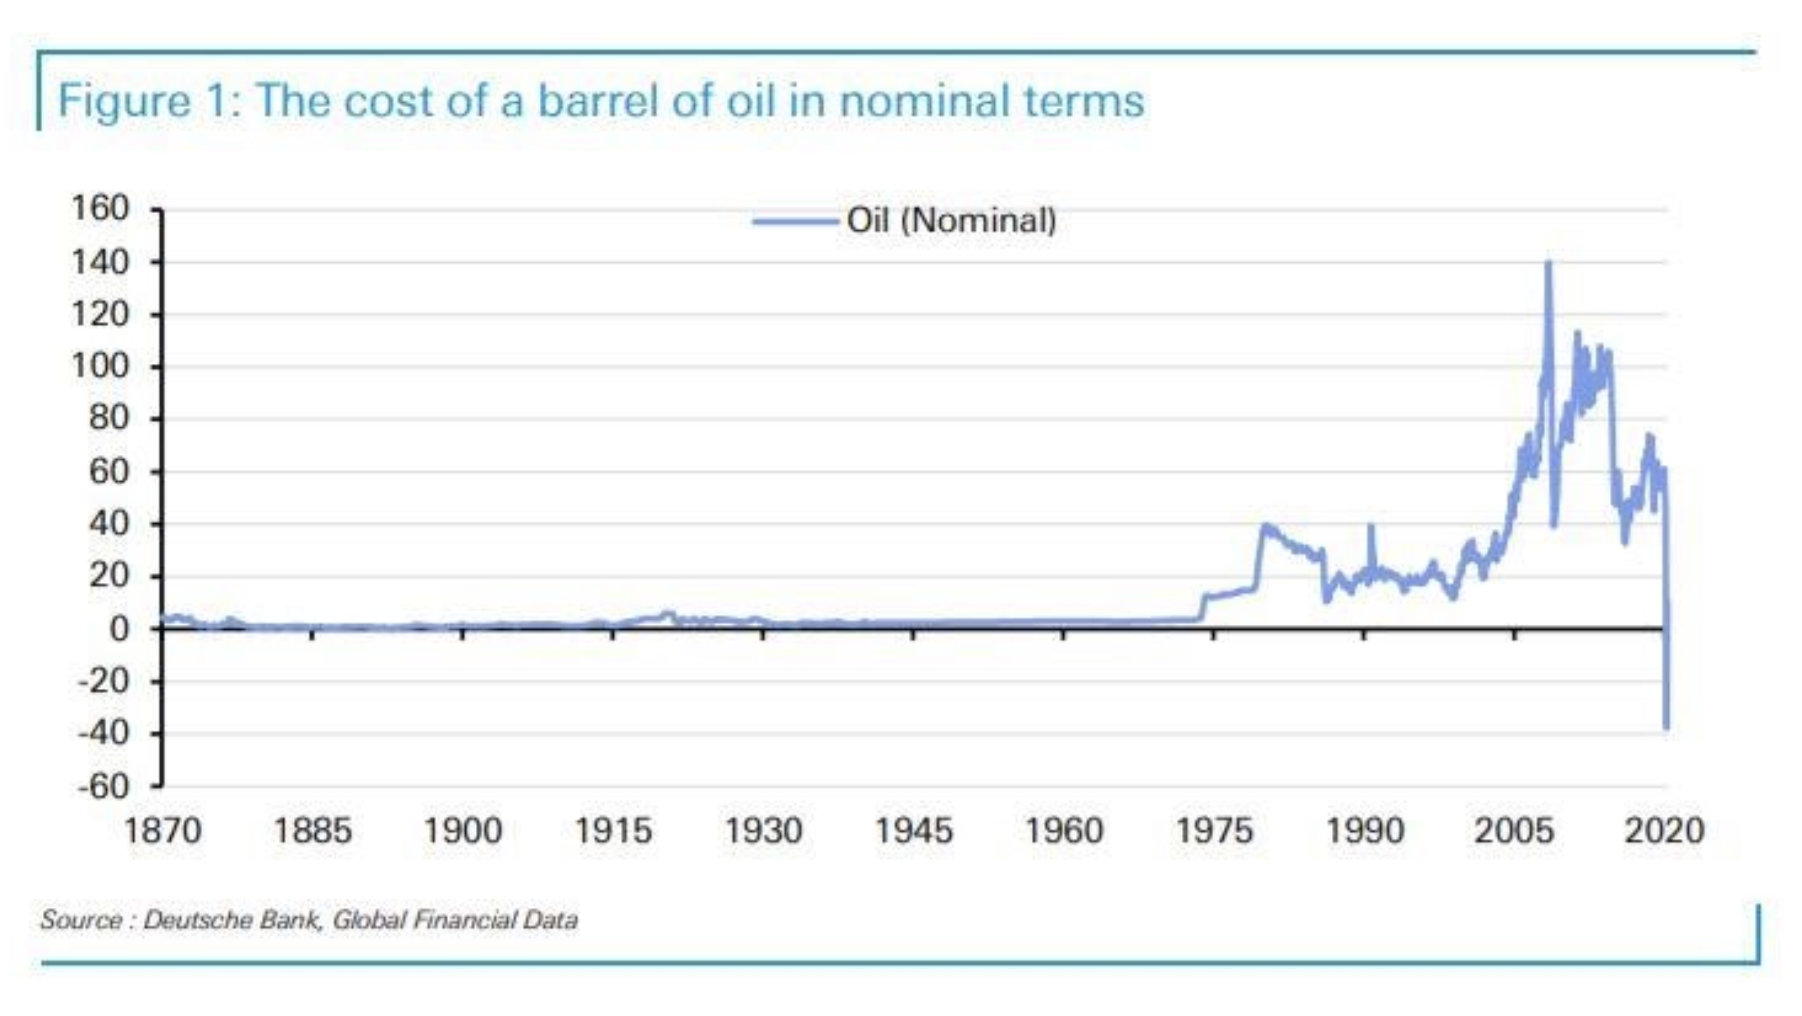
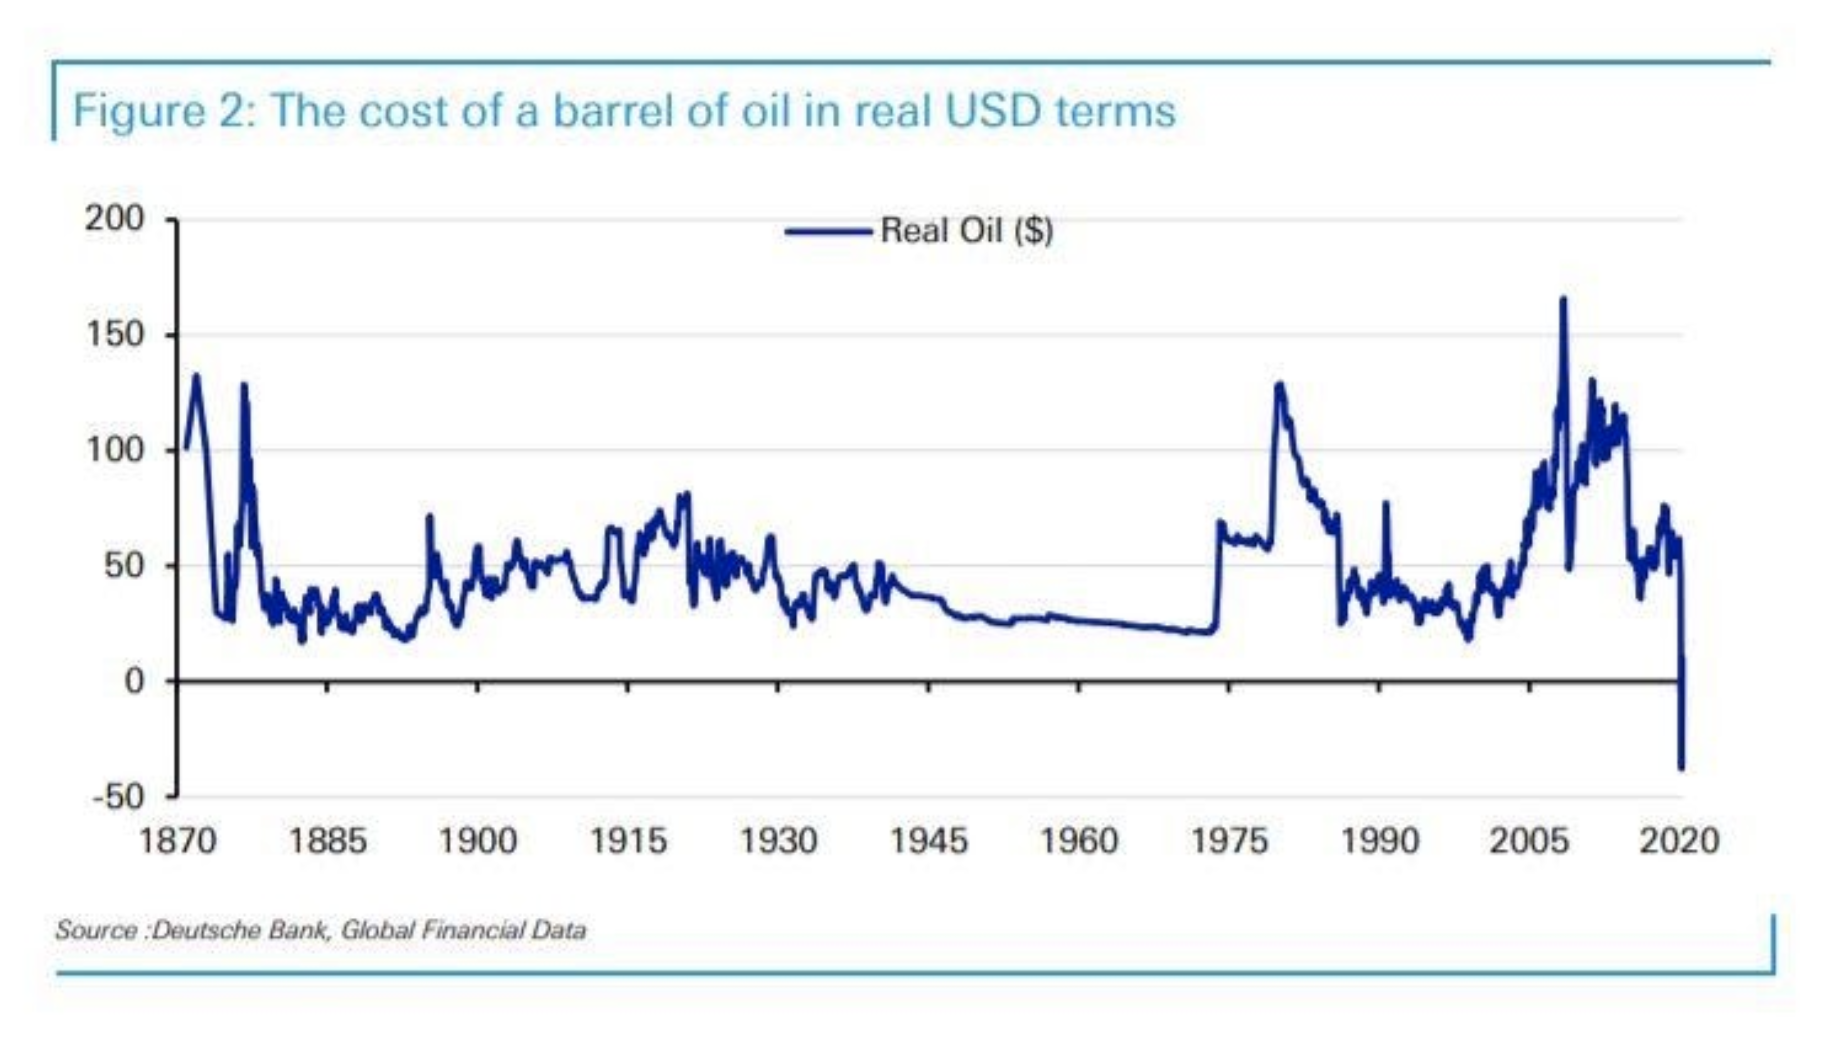
To put this week’s plunge into visual context, two strategists from Deutsche Bank, Jim Reid and Nick Burns, plotted oil prices going all the way back to 1870 in both nominal price and inflation-adjusted.
Amazingly, in nominal prices, oil was cheaper on Monday than it was 150 years ago in 1870.
“In nominal terms, it’s not a surprise to see that, over the 150 years for which we have data, there’s never been a negative price print before,” wrote Reid and Burns.
“This is stunning as it basically says that a barrel of oil earlier this week was effectively cheaper than it was in 1870.” they added.
You can see their charts below, the first one is nominal prices, the second is inflation-adjusted.


Source: Deutsche Bank
What This Brought
Fallout from Monday’s historic price collapse continues to dog the US Oil Fund ETF (USO). As we’ve covered, the ETF has quickly had to adjust its structure to avoid more massive losses as the price of oil futures keeps falling. The fund switched from only front-month contracts to allow contracts for a series of months in different amounts.
Today, it announced another switch in an attempt to stay afloat: an 1-for-8 reverse stock split. The move, which would take place after the market’s close on April 28, effectively shrinks the number of shares outstanding by 8x and multiplies the share price 8x. Nothing else about the fund changes, and investors won’t own more (or less) of the fund.
Kyle Bass, CIO of Hayman Capital Management, quickly tweeted his thoughts, calling the move “garbage.”
“After vaporizing billions from unweary investors this week alone, the retail killer USO begins the day at a 36% premium to its current asset value of $2.06. Reverse splitting garbage continues to give you garbage.”
Also warning retail investors to be cautious is Warren Pies, an energy strategist at Ned Davis Research. He says that most don’t fully understand what they are investing in.
“At best, they are expensive ways to gain programmatic futures exposure. At worst, they are designed to implode. Still, money continues to flow into the USO ETF. As of last week, USO’s assets reached an all-time high of more than $5 billion. To reiterate: In this environment, USO is a train wreck. Stay away.”
Unfortunately, for investors who piled into the ETF, thinking they were timing the bottom, the warning may be too little, too late.
Up Next:


