
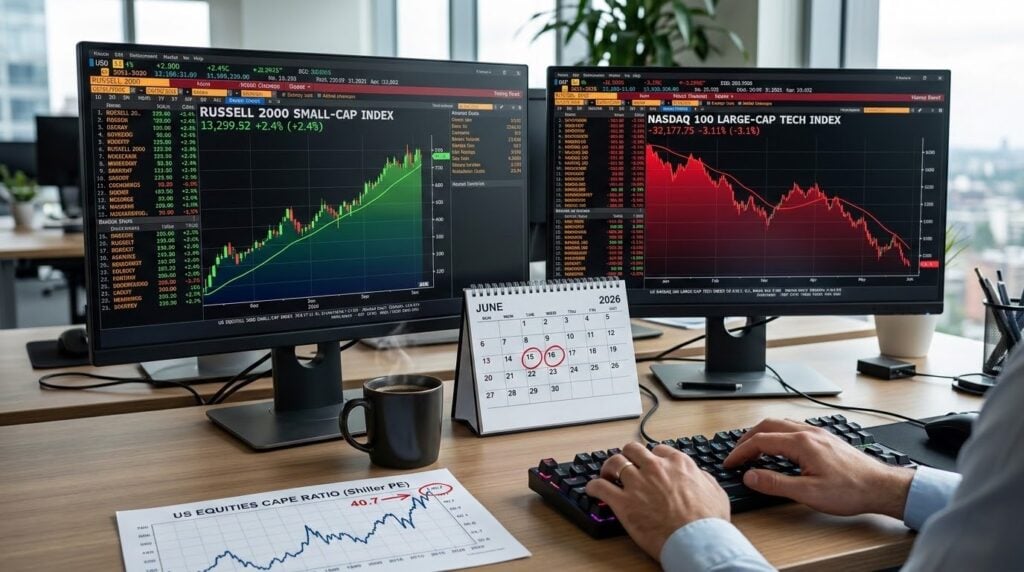
The S&P 500 Shiller CAPE ratio sits at roughly 40.7 as of June 2026. The historical median is 16. The 20-year average is 27.6. That gap tells you something about where the money has been sitting and why it might be moving.
For the first four months of 2026, it did move. The Russell 2000 climbed over 11% by late April, outpacing the tech-heavy Nasdaq-100 by the widest margin in years. Small-cap value names that had spent three years in the shadow of the Magnificent Seven were suddenly drawing institutional capital. Financial media called it “The Great Rotation.” Bank of America’s head of US equity strategy described it as a potential leadership change, with former market laggards taking the baton from momentum stocks.
Then May happened. Mega-cap tech regained momentum. The Nasdaq-100 surged ahead to roughly 21% year-to-date. The Russell 2000 sat at roughly 16%. The rotation appeared to stall, and every investor who had moved capital based on the headline was left with the same question: Was that real, or did I just chase a head fake?
The incredible returns of the last three years have been driven primarily by a small group of companies. That concentration is what makes this moment consequential. When one sector accounts for more than a third of the S&P 500’s market cap, even a partial rotation reshuffles billions. Getting this call right matters. Getting it wrong costs more than sitting still.
What a Real Stock Market Rotation Looks Like
Most investors hear “rotation” and picture a clean handoff. Money leaves tech, enters value, and stays there. That rarely happens. What actually happens is a series of partial shifts, reversals, and retests that eventually resolve in one direction. The challenge is reading the signals before the resolution is obvious.
There are five signals that separate a structural rotation from a temporary rebalance. None of them works alone. All five together create a diagnostic you can run before you move a dollar.
Signal 1: The valuation spread between sectors exceeds historical norms.
The Shiller CAPE for the broad S&P 500 is above 40. But that number masks a lopsided distribution. Technology and growth sectors carry the highest forward price-to-earnings multiples in the index, while value sectors like financials, industrials, and energy trade at multiples that sit closer to or below their 10-year averages. When that spread widens beyond a threshold of roughly 15 points on forward P/E, it signals that one side of the market is priced for a future the other side is not. This is the first structural condition for rotation.
The spread does not tell you when the rotation happens. It tells you the spring is loaded.
Signal 2: The implied equity risk premium diverges between value and growth.
This is the signal most investors skip because it sounds technical. It is also the most reliable. The equity risk premium is the extra return the market demands for owning stocks instead of Treasury bonds. When it narrows for growth stocks while widening for value stocks, the market is saying that investors want more compensation for owning what has already run and are willing to accept less for what has lagged. That is a repricing of future cash flows, not just a sentiment shift.
If you see capital moving from tech to value without an ERP divergence, the rotation is likely driven by quarter-end rebalancing or tax-loss selling. Those reverse within weeks. An ERP divergence sustains across quarters.
Signal 3: Forward earnings revisions favor the receiving sector.
Money follows price. But durable rotations follow earnings. When analysts begin revising earnings estimates upward for value and industrial sectors while holding or cutting tech estimates, the fundamental case for rotation is building. Price-only rotations, where money moves to cheaper stocks simply because they are cheaper, tend to mean-revert quickly. Earnings-driven rotations, where money moves because the businesses themselves are improving, create new leadership cycles.
Track the ratio of upward to downward earnings revisions for the S&P 500 Value Index versus the S&P 500 Growth Index. When the value ratio overtakes growth for two consecutive quarters, the rotation has fundamental backing.
Signal 4: Capital flows sustain for two or more consecutive quarters.
A single quarter of outperformance is noise. Two quarters is a signal. Three is a trend. In 2026, small-cap and value outperformance lasted from roughly January through April before tech reasserted. That is one quarter and change, not enough to confirm structural rotation on this signal alone.
Fund flow data from institutional sources like the Investment Company Institute and Morningstar Direct tracks where money is moving in real time. Look for sustained inflows into value ETFs (like Vanguard Value ETF, ticker VTV) and outflows from growth-heavy vehicles. A month of movement is positioning. Six months of movement is conviction.
Signal 5: Market breadth expands in the receiving sector.
Breadth measures how many stocks are participating in a move. A rotation is suspicious if only a handful of value names are driving index performance. It is credible if advancing stocks outnumber declining stocks across the entire receiving sector for an extended period.
The advance/decline line for the S&P 500 Value Index should be trending upward independently of any single large-cap name. If the rotation is being carried by one or two dividend aristocrats while the rest of the value index sits flat, you are looking at a stock-specific event, not a sector rotation.
Why Most Rotation Trades Fail
Here is the uncomfortable part. Even when the rotation is real, most individual investors who try to trade it still lose.
The reason is behavioral. Retail investors tend to act on rotations after the move has already started. They sell the winners and buy the laggards, which is the right idea at the wrong time. The DALBAR Quantitative Analysis of Investor Behavior shows that the average investor underperforms their own funds by 3% to 4% per year, and the primary cause is exactly this kind of chasing. Vanguard’s research on dollar-cost averaging versus lump sum investing reinforces the point: staying invested consistently outperforms tactical reallocation in roughly 70% of historical periods.
“I have been burnt twice.” That is a direct quote from an investor posting on a finance forum in 2026, describing the experience of acting on a market trend that reversed before they could benefit. It captures the central problem with rotation trading: the entry point is almost always too late.
The cost of switching into a rotation after it appears in headlines is almost always higher than the cost of staying in a total market index and doing nothing. That is not an argument for passivity in all cases. It is an argument for requiring diagnostic evidence before acting.
There is also a credible counterargument that the entire sector-level framework is wrong. Some of the most successful long-term investors have argued that macro rotation calls are noise and that the individual stock you understand, the business you can explain in two sentences, outperforms any top-down thesis over a full cycle. If you can calculate the ratio of a company’s price to its earnings growth, and that ratio sits below 1.0 for a company you know from direct experience, that single-stock conviction beats rotating between sector ETFs.
This view has merit. But it requires a level of individual research time that most retail investors do not have. For the majority of readers, the diagnostic framework is the more practical tool.
A Diagnostic You Can Run Before You Move
The five signals create a checklist. Score each one as present, absent, or unclear. If three or more are present, the rotation has structural backing and deserves a portfolio response. If fewer than three are present, the safer move is to hold your current allocation.
But the right response depends on one variable that has nothing to do with the market: your time horizon.
If your time horizon exceeds 15 years and your portfolio tracks the total market at roughly market weight, the correct response to most rotations is no response at all. The compounding cost of chasing rotation signals, even correct ones, typically exceeds the benefit. The data on this is clear. Dollar-cost averaging into a total market index outperforms tactical rotation in roughly 70% of historical periods. That number gets higher the longer the holding period.
If your time horizon is 5 to 10 years and your portfolio has drifted into heavy tech concentration, the rotation diagnostic becomes more relevant. A portfolio where a single sector represents 35% or more of total value is not diversified. It is a sector bet. Running the diagnostic tells you whether the bet is getting more dangerous or whether the current rotation is a temporary pressure release. If inflation is already eroding your savings, concentration risk in overvalued sectors adds a second pressure your portfolio should not carry.
If CAPE sits above 35 (it currently sits above 40) and your time horizon is under 10 years, the case for reducing overvalued sector exposure and increasing undervalued sector exposure is the strongest. This is not market timing. This is regime-aware allocation. Reducing concentration in a sector trading at historically elevated multiples while adding to sectors trading below historical averages is a structural adjustment, not a prediction.
Specific instruments worth evaluating: the Vanguard Value ETF (VTV), which tracks large-cap value stocks across sectors. The iShares Russell 2000 Value ETF (IWN), which captures the small-cap value segment where institutional rotation has been strongest. And for investors who want to stay fully invested without rotation, the Vanguard Total Stock Market ETF (VTI) remains the hold-everything option that eliminates the need to diagnose anything at all.
Understanding how market cycles work, how to identify where you are in a cycle, and how that knowledge changes your positioning is one of the highest-leverage skills an investor can build. Howard Marks’ Mastering the Market Cycle is one of the clearest frameworks available on exactly this topic. Marks is the co-founder of Oaktree Capital Management and has managed institutional money through multiple full cycles. His core argument is that you cannot predict cycles with precision, but you can assess where you are in the cycle with discipline, and that assessment should influence your level of aggressiveness.

TheCapitalist.com is an educational partner with Amazon Associates. If you purchase through our link, we may earn a commission at no additional cost to you. This does not influence our editorial coverage.
The Stock Market Rotation Verdict

The current stock market rotation from tech to value has two of five structural signals present. The valuation spread (Signal 1) is clear: CAPE above 40, tech multiples elevated, value multiples at or below historical norms. Market breadth (Signal 5) showed expansion in Q1 2026 before narrowing again in May.
The other three signals remain unclear or absent. The equity risk premium divergence (Signal 2) has not sustained across two quarters. Forward earnings revisions (Signal 3) have not decisively shifted toward value. And capital flows (Signal 4) reversed in May after one quarter of momentum.
That score, two out of five, does not support a wholesale portfolio rotation. It does support a diagnostic recheck quarterly and a structural reduction in tech concentration for anyone whose single-sector exposure exceeds 35% of total portfolio value. The spring is loaded, but it has not released. Act on concentration risk. Do not act on rotation headlines.
The next signal to watch is the FOMC rate decision on June 16-17, the first meeting under new Fed Chair Kevin Warsh. Markets are pricing a near-certain hold at the current 3.50%-3.75% range, but the forward guidance language matters more than the decision itself. If the statement shifts toward cuts later in 2026, the rate-sensitive value sectors that benefit from lower borrowing costs get a potential catalyst that could trigger Signals 2 and 3 simultaneously.
Stay invested. Stay diagnostic. And if three of five signals light up simultaneously, that is when the rotation stops being a headline and starts being your portfolio’s problem to solve.
For educational purposes only. Not financial advice.
Frequently Asked Questions
What is the difference between a stock market rotation and a market correction?
A stock market rotation is a shift of capital from one sector or investment style to another within a market that is still broadly rising or flat. A correction is a decline of 10% or more across the broad market, regardless of sector. Rotations happen inside healthy markets. Corrections happen when the entire market reprices downward. You can have a rotation and a correction at the same time, but they are measuring different things.
How long do stock market rotations typically last?
The duration varies widely. Tax-driven rotations at the end of a calendar year can reverse within weeks. Fundamentally driven rotations, where earnings growth shifts from one sector to another, can last one to three years. The longest sustained rotation in recent market history was the shift from growth to value after the dot-com bubble burst in 2000, which lasted roughly seven years before growth reclaimed leadership.
Should I sell my tech stocks during a rotation?
Not based on the rotation alone. The diagnostic framework in this article requires three or more structural signals to be present before a portfolio response is warranted. Even then, the response is not “sell tech.” It is “reduce concentration.” If tech represents 35% or more of your portfolio, rebalancing toward a total market or value allocation is a structural adjustment. If tech represents a market-weight share, the more productive response is to hold and reassess quarterly.
Is a value tilt the same as timing the market?
It depends on how you implement it. A permanent value tilt, where your portfolio consistently overweights value relative to the total market, is a structural allocation choice, not a timing call. Switching from a total market index to a value fund after value has already started outperforming, then switching back when tech recovers, is market timing with a different label. The distinction is whether the allocation change is driven by a durable strategy or a reaction to recent performance.