

MarketTamer | by
Posted on March 27, 2015
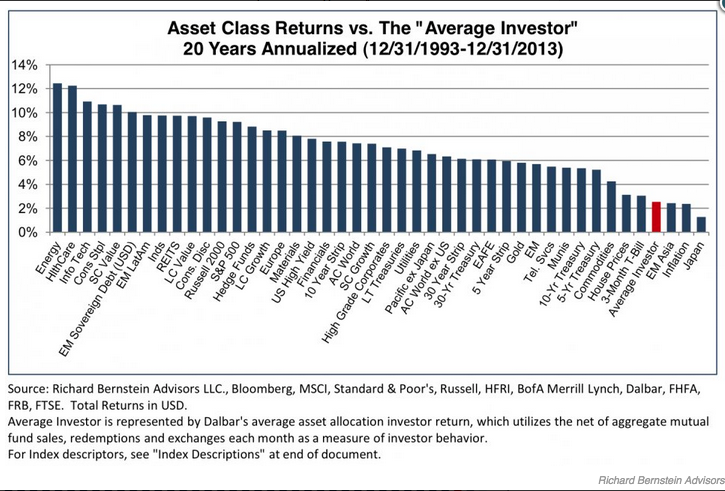
Take a moment to examine this chart of investment performance closely[1]. Please ignore the precise X Axis titles and presume (for the moment) that my personal average investment performance between 1994 and 2013 is represented by the fourth column from the right (in red)… and is herein compared with the investment performance of a wide-range of asset classes.
OK… let me hear your reaction…. And don’t hold back!
Ah, I see that a few of you are demonstrating compassion by not calling me “inept”, “horrible”, “an investment dunce”, or “hopeless”, etc. And I see that others of you are quite willing to be brutally honest – sharing such thoughts as “Boy, am I glad I didn’t have YOU managing my money” or “Geez, your pathetic performance makes me feel GREAT about my own average return!”
That pretty much sums it up, doesn’t it? Earning an average of just over 2% on one’s money over the course of 20 years is very, very sad!!
However, that graph (as you’ve surely figured out by now) does not really compare my personal return vis-à-vis a wide range of asset classes. Instead, it represents the average return of “John Doe” (the “average” investor) compared with the return offered from all 43 of the asset classes shown!!!!
Think of it this way: If John Doe had chosen any one of those asset classes on January 2, 1994 and held his money in that asset class during the entire period … he would have had a 97.67% chance of achieving a BETTER return than he actually earned!
Consider the returns “John” could have had by keeping his money in any one of the following asset classes (I have estimated the average return based upon the chart):
U.S. Treasury Bills[2] 2.50%
10-Year U.S. Treasury Notes 5.75%
Utility Index 6.50%
U.S. High Yield Bonds 7.90%
The S&P 500 Index 9.10%[3]
And (of course) accentuating my very point regarding how poorly the average investor does with her/his investments are these two additional observations:
If “John” had kept all of his investable assets in just one single asset class, he would have violated every sound investment principle I can think of… including (most obviously) the central, timeless, overriding, indispensable rule regarding the absolute need for DIVERSIFICATION among assets (and even within asset classes).
Of course, keeping all funds in just one asset class over the course of 20 years also ignores the need for regular REBALANCING of one’s portfolio!! By “rebalancing” one’s portfolio across a variety of asset classes on a regular basis… an investor is applying (in a systematic way) the first principle of investing: “Buy low and sell high!”[4] Rebalancing on some regular basis is the only way to ensure than an investor’s preferred risk/return profile is maintained within a portfolio over time!
So there we have the performance of “John Doe” – our average U.S. Investor!
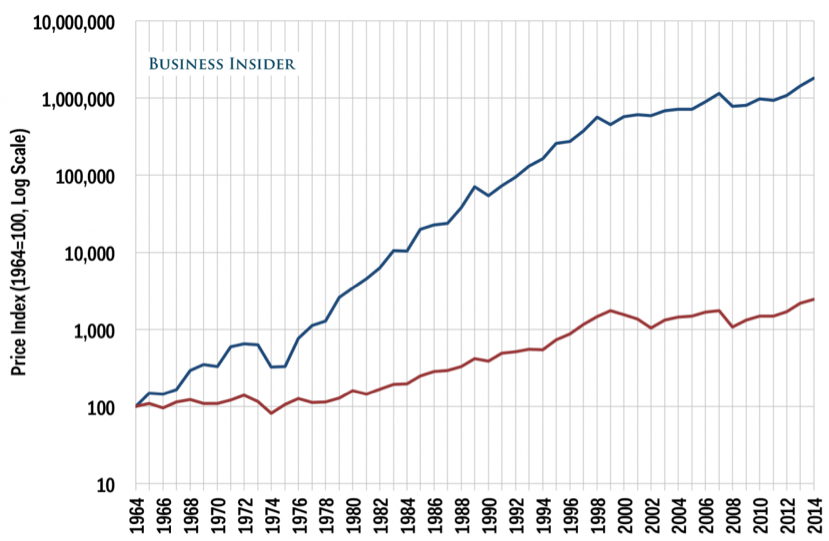
What can you make of the following chart? (Assume for a moment that my personal investment return from 1969 through 2013 is in blue while the return from of the S&P 500 Index is in red!)
Well, friends! What do you think of my investment prowess now??
All of you folks who referred to me as “dunce”, “horrible”, “inept”, etc. – would you care to say “I’m sorry that I doubted you!”?[5]
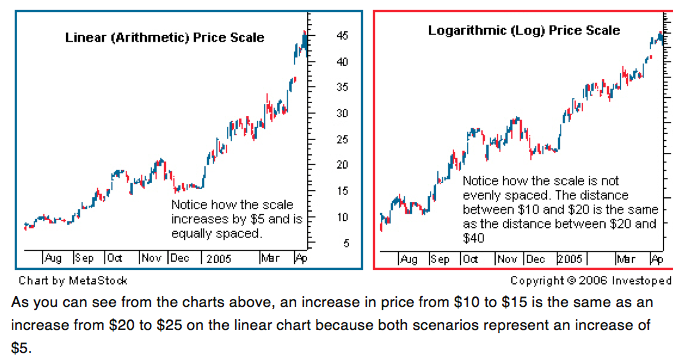
Please note, folks, that the above chart is not a “standard” linear performance chart… but rather a logarithmic chart. Investopedia.com does a great job of explaining the difference between these two types of charts:
“A linear price scale is plotted on the side of the chart so that there is an equal distance between the prices, and each unit change on the chart is represented by the same vertical distance on the scale, regardless of what price level the asset is at when the change occurs.
“By contrast, a logarithmic price scale is plotted so that the prices in the scale are not positioned equidistantly; instead, the scale is plotted in such a way that two equal percent changes are plotted as the same vertical distance on the scale.”
The reason a “Log Chart” is needed is because the performance shown on the blue line so thoroughly smoked the performance of the S&P 500 that a linear graph could not possibly do justice to any attempt to visually illustrate the incredible scale of this outperformance!!
To be specific, the performance between 1964 and 2014 illustrated by the blue line totals up to aggregate growth of 1,800,000%!! Meanwhile, during the same period, the S&P 500 Index appreciated by (just) 2,300%!
Of course, if I had actually been the portfolio manager of the assets displayed above, you would have heard of me long before I started being found within Market Tamer! In fact, I would have been appearing regularly on Wall Street Week and on FNN[6] during the 1970’s and 1980’s, as well as being written up in the Wall Street Journal and Barron’s!!
As you’ve surely guess by now, the person who actually guided this portfolio to the incredible performance shown in the logarithmic graph above is none other than the most ubiquitous name/face in all of financial media today: Warren Buffett – a man so often referred to as avuncular, jocular, loquacious, grandfatherly, folksy, etc. that it is almost impossible to comprehend that he shares a professional investment stage with some of the most cut-throat, “me-first”, deceptive, untrustworthy, and unprincipled folks of the 21st Century.[7]
As you’ve likely heard, the 2014 Annual Report from Berkshire Hathaway Inc. (BRK.A; BRK.B) was released on February 27th… and celebrates the 50th Anniversary of Buffett’s leadership within the company!
![]()
If you had been close enough to Buffett in 1964… invested personal funds in BRK.A… and held on until now, each dollar invested would be worth $1.826 million today![8]
It is no surprise then that, within the investment world, Buffett has become an icon[9] without peer… an authority without equal.[10] As a natural consequence, when an author creates a title for an investment publication, the most commonly used word (name) added to that title (in an attempt to hijack attention, search results, “eyes”, “clicks”, and readership) is none other than “Buffett” (bar none!).
But as we know, those who reach the “heights” of success and fame quickly and regularly become “targets” for critics who revel in pointing out any “warts” that might develop within the evolving narrative of such a figure.
That fate has not escaped Buffett. Since 2007, an extensive number of critics have gone to great lengths to illustrate the ways in which Buffett’s “outperformance” has diminished within the past 10-15 years.
My response to such critics is: “Duh! When you grow from a small (obscure) aging, fading textile manufacturer in 1964 into one of the biggest and most successful corporations on the world stage… of course your ‘outperformance’ will be impacted!” It is much harder to grow a huge corporation with many moving, disparate parts than to grow a smaller, more compact company!
Take a look at this graph of what amounts to a rolling five-year average of “Growth Rate” for BRK.A vis-à-vis the S&P 500 during the past 50 years:

Why was Buffett “slowing up”?
Because the company he has been growing steadily for 50 years has really and truly “grown” with a capital “G”! Look at the following “lists” of current major global corporations:
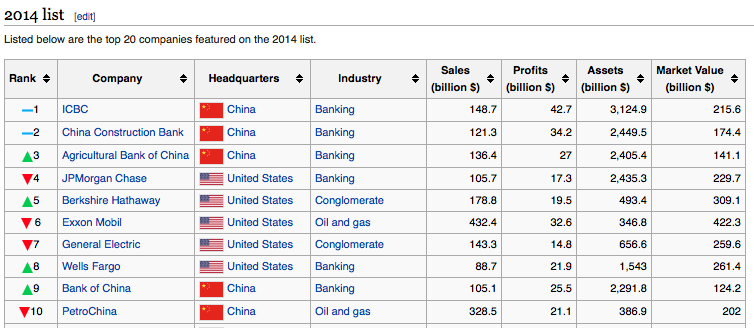
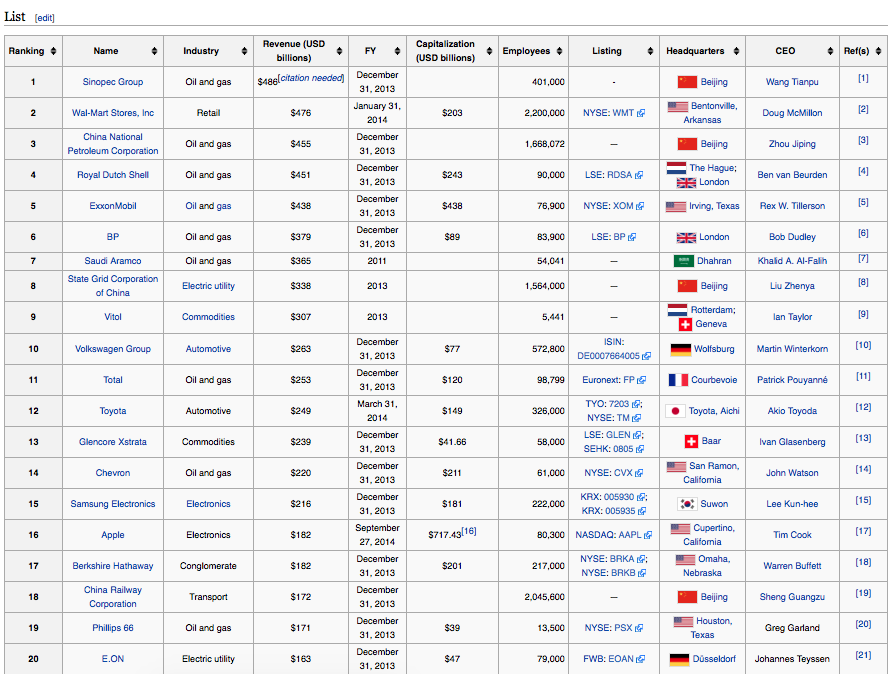
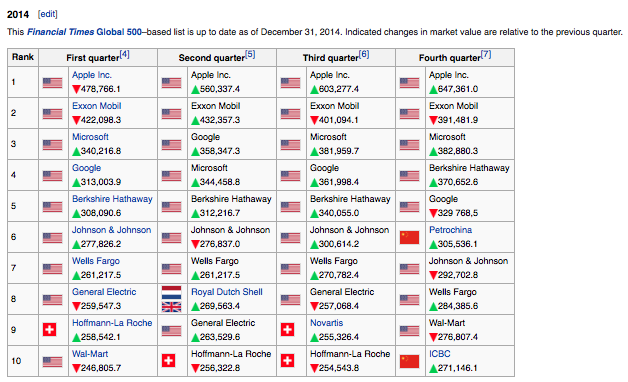
Everyone who knows what she/he is talking about knows that it is extremely difficult to keep growing a huge corporation at the same rate it was growing when it was much smaller! (“Everyone” that is, except the naysayers who revel in taking swipes at Buffett!).
That being said… take a look at the BRK.A stock price during 2014!
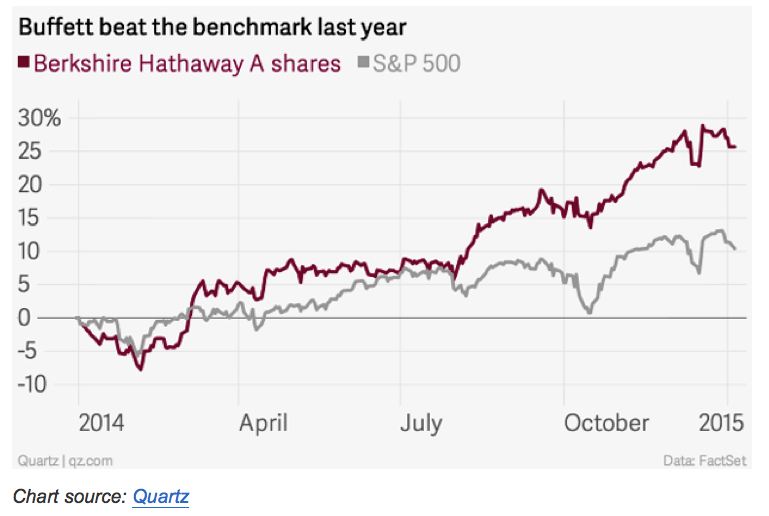
Buffett, the wily veteran, pulled off a coup… outperforming the S&P 500 by a factor of almost two (27.25% to 13.7%)! In fact, in January, BRK.A reached an all-time high!
What can account for this dramatic outperformance?
As we know, for quite some time “Wall Street” focused almost entirely upon Buffett’s stock picking acumen. He was viewed as much as a “portfolio manager” as he was a “Corporate CEO”. As Bloomberg explained in January[11]:
“Not too long ago, Berkshire was seen as a way to buy into the billionaire’s skill picking stocks. These days, it’s primarily a bet on his ability to make acquisitions and distribute funds among the dozens of businesses he bought over the past five decades, including electric utilities, manufacturers, retailers and one of the largest U.S. railroads.”
This development should not have been a surprise to anyone who paid heed to Buffett’s own words last year, when he alerted folks to his conviction that Berkshire’s future would be focused upon buying big businesses and expanding them over time! So Buffett has shifted the weight of his asset allocation from primarily owning stocks to acquiring additional, promising, attractively-priced businesses.
Illustrating the acumen that makes Buffett who he is, he paid over $26 billion in February of 2010 for the remaining portion of the BNSF railroad that BRK.A did not already own. Many “experts” thought he was crazy.
However, while the U.S. economy was still struggling in 2014, profits generated by BNSF grew approximately 5% — totaling over $1 billion. And Buffett’s energy/utility companies reported profit growth of nearly 48%!
Of course, Buffett has not yet demonstrated mastery of “walking on water”. He is not perfect, and not everything he “touches” turns to gold. Cases in point from 2014 include his major stake in IBM (a core holding… that continued down another 14%) and his mistaken handling of Tesco PLC (Teso)[12] that cost BRK.A a loss of nearly $700 million. See the two-year chart below of the stock:
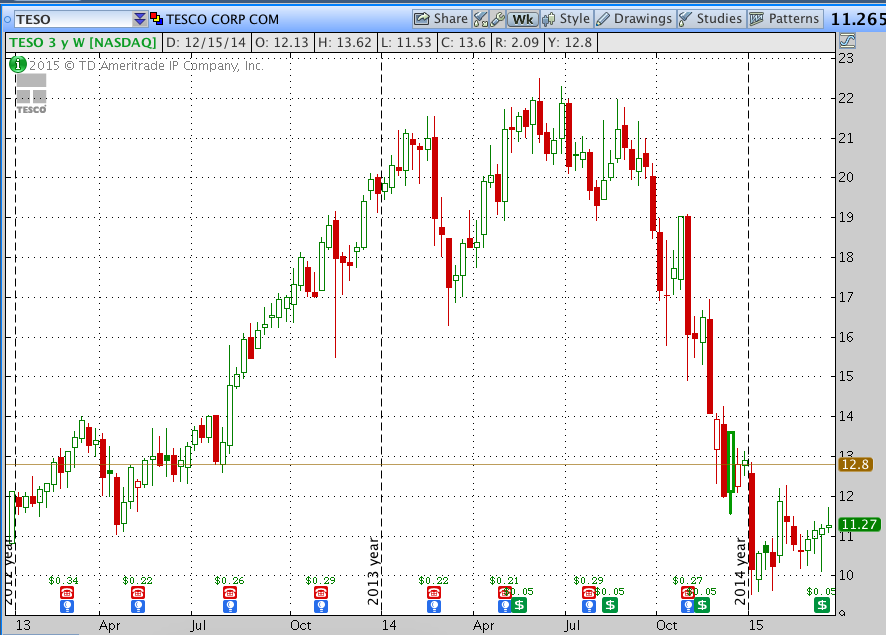
In an endearing section of his February Shareholder Letter, Buffett entered a virtual confessional and admitted he was guilty of “thumb sucking” in failing to get out of TESO long before it cratered. BRK.A had accumulated a large stake in the stock by the end of 2012. As you can see above, the stock moved inexorably higher throughout 2013 (great timing, Mr. Buffett!). Therefore, in the first half of 2014, Buffett had accumulated such significant gains that he had become lulled into a form of complacency – complacency that he recognizes now should never have been tolerated.
Despite those “chinks” in Buffett’s “armor”, his sterling management of BRK.A and his other excellent stock picks provided the company with sufficient diversification to weather the mini-storms such as IBM and TESO!!
A case in point of “excellent management” by Buffett was his decision long ago to invest big in Wells Fargo (WFC) (now BRK.A’s largest holding). That stock jumped up by 21% during 2014.
The following two significant developments demonstrate the degree to which Buffett is serious regarding his commitment to balance stock picking with corporate acquisition:
1) CASH ON HAND:
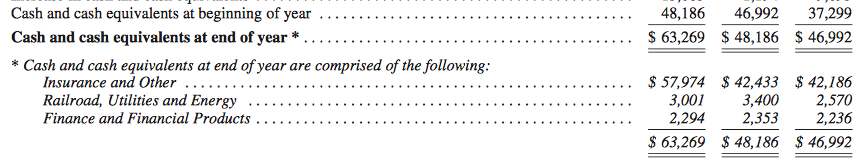
As you can see in this excerpt from the 12/31/14 financial statement, Buffett has accumulated a cash horde exceeding $63 billion — $15.1 billion (or over 31%) more than either of the prior two years.
2) MANAGEMENT TRAINING:
Buffett knows he can’t live forever. He is trying to prepare skilled, dependable leaders for the future of BRK.A. As most of you know, several years ago started passing off some of the daily stock portfolio management responsibility to much younger Todd Combs and Ted Weschler. In his 2013 Shareholder Letter, Buffett wrote this:
“In a year in which most equity managers found it impossible to outperform the S&P 500, both Todd Combs and Ted Weschler handily did so. Each now runs a portfolio exceeding $7 billion. They’ve earned it.” (Buffett went on to say they outperformed him in 2013).
In the most quotable (and colorful) section of his 2014 Shareholder Letter, Buffett explained the next (essential) step in the full development of Combs and Weschler as future BRK.A leaders.
“I’ve mentioned in the past that my experience in business helps me as an investor and that my investment experience has made me a better businessman. Each pursuit teaches lessons that are applicable to the other. And some truths can only be fully learned through experience. (In Fred Schwed’s wonderful book, Where Are the Customers’ Yachts?, a Peter Arno cartoon depicts a puzzled Adam looking at an eager Eve, while a caption says, “There are certain things that cannot be adequately explained to a virgin either by words or pictures.”
Among Arno’s “certain things,” I would include two separate skills,
1) the evaluation of investments and
2) the management of businesses.
“I therefore think it’s worthwhile for Todd Combs and Ted Weschler, our two investment managers, to each have oversight of at least one of our businesses. A sensible opportunity for them to do so opened up a few months ago when we agreed to purchase two companies that, though smaller than we would normally acquire, have excellent economic characteristics. Combined, the two earn $100 million annually on about $125 million of net tangible assets.”
As a result, now Combs and Weschler serve as CEO of a BRK.A-owned company. Buffett is confident that the “hands on” experience will be certain to enhance their eye for, and success in, stock picking!
It is essential to also point out an additional, yet infrequently cited, key element of the success of BRK.A and Buffett! There is no corporate “bloat” at BRK.A. I was just reminded of the number of folks who are on the payroll within the international corporate headquarters in Omaha, NE. Do you care to guess how many there are?[13]
Therefore, BRK.A’s December 31, 2014 Annual Report does not just glory in the unmatched past success of Warren Buffett in creating, nurturing, growing, inspiring, and managing a little New England textile company into a global corporate power! Instead, it balances a look at the past with a direction for the future.
Buffett’s self-expressed turn toward a renewed focus upon buying companies instead of just stocks does not suggest (in any way) that “stock picking” is being dropped at BRK.A (or even diminished). It merely means that company acquisition will draw a much greater focus than it has in some recent years.
It is with regard to “stock picking” that Buffett offered (in this most recent Shareholder Letter) what might be considered his “most powerful” lesson to folks such as you and I.
I have added an APPENDIX at the end of this article which contains… verbatim… the section of Buffett’s February 27th Shareholder Letter that offers the most relevant advice for the average investor.[14] For those who might not have the time or patience to read through his text in its entirety, here are my own bullet points summarizing what I believe to be the essence of Buffett’s “lesson” for us:
1) “Tailwind”: Between 1964 and 2014, Berkshire Hathaway benefitted from an amazing upward trend within the S&P 500 Index: offering a total return of 11,196%.
2) During the same period, the purchasing power of the U.S. Dollar declined by 87%! (Using the Consumer Price Index, what costs $1 today would have cost only 13 cents in 1965!![15])
3) Therefore, an investment in stocks has offered a far superior means of maintaining and enhancing purchasing power than has investment in such instruments as U.S. Treasury Securities! Hence we need to rethink our understanding of what constitutes a “safe” investment! (Buffett labels government securities as “currency-denominated” instruments — U.S. securities being in U.S. Dollars, Japanese securities being in denominated in Yen, etc.[16]
4) Specifically, although it is true that over any given short-term period, stock prices will always be more volatile than cash-equivalent holdings… over the long haul, currency-denominated securities will always be far riskier investments than a widely diversified, well-allocated portfolio that is dominated by equities.
5) Business schools generally miss this key point. It is commonly taught that “Volatility” and “Risk” are nearly synonymous. That is a patently mistaken axiom!! The only validity for the use of rubric is when an investor is focusing upon achieving a financial goal over a short to intermediate term period. In those instances, weighting the related investment dollars toward less volatile investment choices (Treasury Bills, Notes, etc.) makes sense!
6) However, for achieving such goals as a sustainable retirement or the building of family wealth – the majority of investors should ignore day-to-day and week-to-week equity declines and focus on a multi-decade horizon!
7) Those investors who are unable to demonstrate the discipline described in point 6) will almost certainly fall prey to “Fear”… which most often leads to “Risk”. Namely, the risk of:
a) Selling low after buying high
b) Over trading
c) Horrible market “timing” –
i) Example: the millions of investors who stayed “out” of the market when things looked most bleak in 2009, 2010, etc. and only stepped back into stocks during 2013 or 2014, after a huge stock price recovery had already taken place!
ii) They suffered a major “lost opportunity”
8) Instead of paying advisors, brokers, hedge fund mangers, etc. high fees for advice and/or portfolio management, the average investor would be far better served by simply buying a very low-cost index fund whose dividends would trend upward over the years and whose principal would grow as well.
a) “Market forecasters will fill your ear but will never fill your wallet.”
b) In fact, the biggest institutional investors are not immune from the same mistakes made by the small investor.
i) Viewed as a group, these big investors have long underperformed the unsophisticated index-fund investor who simply sits tight for decades
c) Most advisors are far better at generating high fees than they are at generating high returns.
Summing up….
“Decades ago, Ben Graham pinpointed the blame for investment failure, using a quote from Shakespeare: ‘The fault, dear Brutus, is not in our stars, but in ourselves.’”
INVESTOR TAKEAWAY:
There are several key points that flow from the above that we would do well to remember and/or reflect upon further:
1) It is far too easy for the average investor to get severely distracted by the day-to-day and week-to-week “noise” in the market[17]
2) Such distraction only serves to make investors fearful, which usually leads investors to make emotional decisions, which almost always leads to poor investment choices!
3) No wonder, then, that “John Doe” only received an average annual return between 1994 and 2013 of just over 2%!
4) To improve their portfolio return, investors need to do the following:
a) Focus on a long-term[18] view of the market;
b) Rethink the meaning of the term “Investment Risk”.
i) Our understanding of “Risk” should encompass much more than just “volatility”… It should include:
ii) Purchasing Power
iii) Financial stability of a company (or country)
iv) The inverse movement of bond prices vis-à-vis interest rates
v) Lost Opportunity (such as those who stayed out of equities after March of 2009)
5) Re-evaluate your “advisors” on a “Cost/Benefit” basis!
a) Do your advisors truly “add value” to your portfolio?
b) Is your “After all fees” investment return less than, equal to, or greater than the comparable period return from a passive index fund (such as SPY, VOO, IWM, QQQ etc.)
6) BRK.A/BRK.B stock remains an exceptional choice as a well-diversified equity investment option – particularly since Buffett is returning to his long-time forte of “buying companies” instead of just “stocks”.
7) For those leery of any one “company” stock… it is always acceptable to make the choice Buffett has already made for his estate[19]: a passive index fund such as those offered through the Vanguard Group (or Fidelity, Schwab, etc.).
DISCLOSURE:The author has (in the past) owned BRK.B. He currently owns any number of passive index ETFs and funds. Nothing in this article is intended as a recommendation to buy or sell anything. Always consult with your financial advisor regarding changes in your portfolio – either subtractions or additions.
APPENDIX:
(The following is excerpted from Warren Buffett’s 2014 Shareholder Letter. The paragraph formatting and the bold font has been added by the author for emphasis.)
“Our investment results have been helped by a terrific tailwind. During the 1964-2014 period, the S&P 500 rose from 84 to 2,059, which, with reinvested dividends, generated the overall return of 11,196% shown on page 2.
“Concurrently, the purchasing power of the dollar declined a staggering 87%. That decrease means that it now takes $1 to buy what could be bought for 13¢ in 1965 (as measured by the Consumer Price Index).
“There is an important message for investors in that disparate performance between stocks and dollars. Think back to our 2011 annual report, in which we defined investing as “the transfer to others of purchasing power now with the reasoned expectation of receiving more purchasing power – after taxes have been paid on nominal gains – in the future.”
“The unconventional, but inescapable, conclusion to be drawn from the past fifty years is that it has been far safer to invest in a diversified collection of American businesses than to invest in securities – Treasuries, for example – whose values have been tied to American currency.
“That was also true in the preceding half-century, a period including the Great Depression and two world wars. Investors should heed this history. To one degree or another it is almost certain to be repeated during the next century.
“Stock prices will always be far more volatile than cash-equivalent holdings. Over the long term, however, currency-denominated instruments are riskier investments – far riskier investments – than widely-diversified stock portfolios that are bought over time and that are owned in a manner invoking only token fees and commissions.
“That lesson has not customarily been taught in business schools, where volatility is almost universally used as a proxy for risk. Though this pedagogic assumption makes for easy teaching, it is dead wrong: Volatility is far from synonymous with risk.
Popular formulas that equate the two terms lead students, investors and CEOs astray. It is true, of course, that owning equities for a day or a week or a year is far riskier (in both nominal and purchasing-power terms) than leaving funds in cash-equivalents. That is relevant to certain investors – say, investment banks – whose viability can be threatened by declines in asset prices and which might be forced to sell securities during depressed markets. Additionally, any party that might have meaningful near-term needs for funds should keep appropriate sums in Treasuries or insured bank deposits.”
“For the great majority of investors, however, who can – and should – invest with a multi-decade horizon, quotational declines are unimportant. Their focus should remain fixed on attaining significant gains in purchasing power over their investing lifetime. For them, a diversified equity portfolio, bought over time, will prove far less risky than dollar-based securities.
“If the investor, instead, fears price volatility, erroneously viewing it as a measure of risk, he may, ironically, end up doing some very risky things.
“Recall, if you will, the pundits who six years ago bemoaned falling stock prices and advised investing in “safe” Treasury bills or bank certificates of deposit. People who heeded this sermon are now earning a pittance on sums they had previously expected would finance a pleasant retirement. (The S&P 500 was then below 700; now it is about 2,100.)
“If not for their fear of meaningless price volatility, these investors could have assured themselves of a good income for life by simply buying a very low-cost index fund whose dividends would trend upward over the years and whose principal would grow as well (with many ups and downs, to be sure).
“Investors, of course, can, by their own behavior, make stock ownership highly risky. And many do. Active trading, attempts to “time” market movements, inadequate diversification, the payment of high and unnecessary fees to managers and advisors, and the use of borrowed money can destroy the decent returns that a life-long owner of equities would otherwise enjoy. Indeed, borrowed money has no place in the investor’s tool kit: Anything can happen anytime in markets. And no advisor, economist, or TV commentator – and definitely not Charlie nor I – can tell you when chaos will occur.
“Market forecasters will fill your ear but will never fill your wallet.
“The commission of the investment sins listed above is not limited to “the little guy.” Huge institutional investors, viewed as a group, have long underperformed the unsophisticated index-fund investor who simply sits tight for decades. A major reason has been fees: Many institutions pay substantial sums to consultants who, in turn, recommend high-fee managers. And that is a fool’s game.
“There are a few investment managers, of course, who are very good – though in the short run, it’s difficult to determine whether a great record is due to luck or talent. Most advisors, however, are far better at generating high fees than they are at generating high returns. In truth, their core competence is salesmanship.
“Rather than listen to their siren songs, investors – large and small – should instead read Jack Bogle’s The Little Book of Common Sense Investing.
“Decades ago, Ben Graham pinpointed the blame for investment failure, using a quote from Shakespeare: “The fault, dear Brutus, is not in our stars, but in ourselves.”
FOOTNOTES:
[1] The chart is from Richard Bernstein Advisors LLC, based on data from Bloomberg, Dalbar, and multiple other sources.
[2] Note that THIS asset is classically referred to as the “RISK FREE” rate! (The notion that the U.S. would default on its Treasury Securities is incomprehensible).
[3] Note that the 9.1% return was achieved DESPITE one of the worst decades of stock performance being included in these figures – the “Lost Decade” between 2000 and 2010 when U.S. stocks returned (in essence) 0%, excluding dividends. Those 10 years included two crashes – the “Dot.com Crash” and the “Financial Crisis Crash”.
[4] To review: “Rebalancing” involves reducing the funds invested in assets that have outperformed during any period (thereby “selling high”) and allocating those funds to asset classes that have had a “subpar” year (thereby “buying low”).
[5] I didn’t think so.
[6] Bet most of you had forgotten about FNN!!
[7] Although none of those folks are nearly as reprehensible as the great John Pierpont Morgan!
[8] A dollar invested in an S&P 500 Index equivalent on the same day would now be worth $11,200. Those of you skilled in math will immediately protest – “But you said it returned just 2,300% during that period!” You’d be right… if we were talking strictly “Price/Share appreciation”. But when comparing BRK.A with the S&P 500, we always need to leave dividends out of the picture, since BRK.A doesn’t pay dividends. The fact that the “Total Return” of the S&P 500 (dollar per dollar) was $11,200 instead of just $2,300 demonstrates the power of dividend reinvestment compounding!!
[9] In some circles, even a “mini-god”… hence his moniker of “Oracle of Omaha”!
[10] Even a “Sage” without “Rosemary” (the name of his wife is “Astrid”… not “Rosemary”.
[11] http://www.bloomberg.com/news/articles/2015-01-05/berkshire-soars-as-buffett-shifts-focus-from-stocks-to-takeovers?hootPostID=6037c7b5317bec13ec389172c84f6129
[12] Tesco PLC is a British multinational grocery and general merchandise retailer
[13] Just 25! Buffett noted that metric in his Shareholder Letter!!!! Buffett invests in people who carry out essential tasks in running actual businesses. He places no value on folks filling slots or titles at a corporate headquarters unless that “slot” or “title” is essential and helps maximize shareholder value.
[14] Note that I have formatted that section of his letter to highlight his key points. But the words are copied straight from his text
[15] Ahhhh…. I am transported back to the halcyon days of yore when I could buy huge five cent candy bars and movie theatre popcorn for 15 cents at the local Pickwick Theater!! (And Saturday matinee cost a quarter!).
[16] It is well worth noting that German Bunds are denominated in the Euro. However, a strong school of thought exists that, in the event of a collapse in the Euro… sovereign debts would be re-denominated into local currencies. Practically no credible expert would question that … in such an event… the Deutschmark would be considered the strongest, most reliable currency.
[17] Including (perhaps especially) the “noise” that emanates from CNBC, Bloomberg TV, Fox Business, etc.
[18] Multi-decade perspective
[19] That is, for the trustee who will manages assets for his (eventual) widow.