
Alan Greenspan died on June 22, 2026, at the age of 100. Newly installed Federal Reserve Chair Kevin Warsh invoked him at his own swearing-in, saying Greenspan was “the first to tell me and show me what this role demands.” The eulogies poured in from former colleagues and market veterans. Most of them mentioned the same two words: irrational exuberance.
What most of the tributes leave out is the part that actually matters for investors. Greenspan did not call the top of the stock market bubble. He asked a question about it. And the market spent the next three years and four months proving that asking the right question and knowing what to do about it are entirely separate problems.
How Long Did Greenspan’s Correct Bubble Call Take to Be Vindicated, and What Did That Cost Investors?
Bubble warnings can be correct in diagnosis and catastrophic in timing. Greenspan’s 1996 speech is the clearest example in Federal Reserve history.
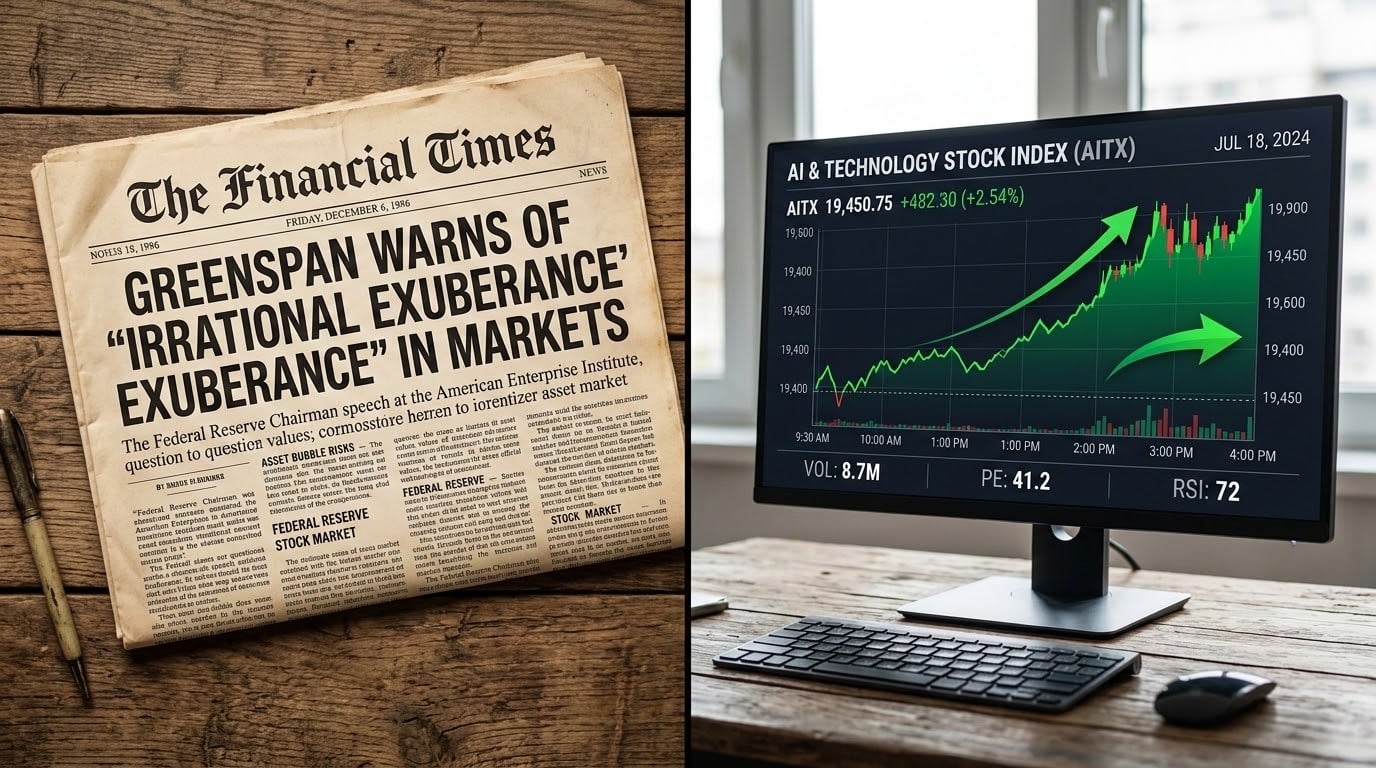
In December 1996, Greenspan addressed the American Enterprise Institute and posed a question that has followed every bull market since: how do we know when irrational exuberance has unduly escalated asset values? He was not predicting a crash. He was asking how central bankers should think about asset prices before the fallout reached the real economy.
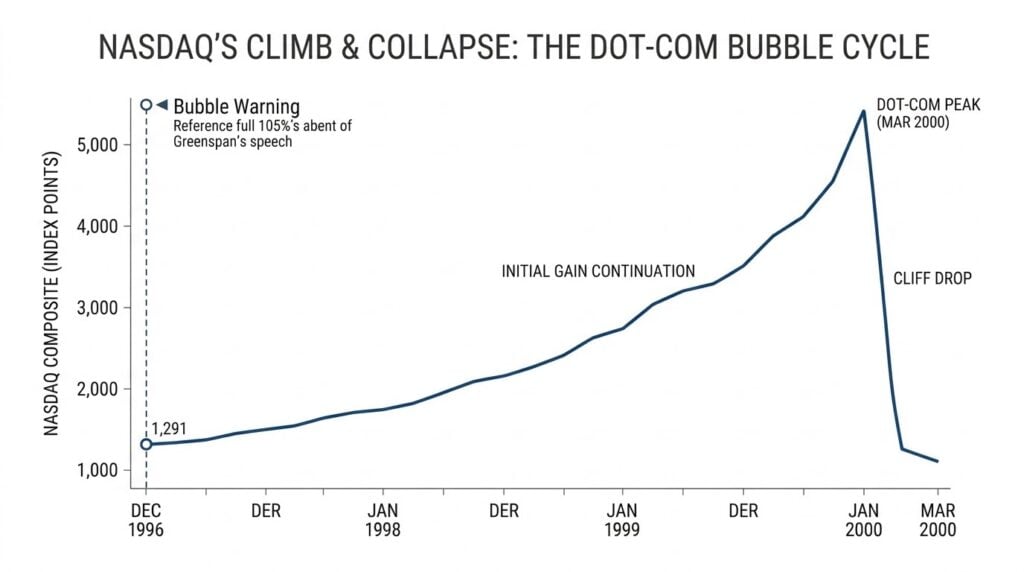
Markets around the world sold off on the speech. Then they kept climbing. The Nasdaq ran from that December 1996 warning all the way to its March 2000 peak, returning 105% to investors who stayed in. By 2003, the Nasdaq had given all of it back and more. Greenspan’s diagnosis was correct. His timing, measured in real investor returns, was catastrophic for anyone who acted on it.
Valuation economist Aswath Damodaran noted in his analysis of bubble timing that being right too early may wipe out the benefits. He observed that any investor who sold equities immediately after Greenspan’s 1996 comments would have underperformed an investor who held on and simply took the hit from the correction when it finally came.
This is the actual lesson of the Greenspan era. Not that bubbles burst. They do. But that the gap between identifying a stock market bubble and its resolution can span years, and that gap has a real dollar cost to investors who act on the signal before the market is ready to confirm it. The new Fed chair’s arrival has brought renewed focus on exactly this dynamic.
Is the AI Rally Following the Same Pattern as the Dot-Com Bubble?
The institutional language around the AI rally has shifted from cautious to pointed — and the valuation comparisons to 1999 are no longer coming only from the bearish fringe.
The comparisons between today’s AI-driven market and the dot-com era of the late 1990s are not new. What is new is how direct the language has become from institutional voices.
In May 2026, JPMorgan Chase chief executive Jamie Dimon told Bloomberg Television that markets may be showing too much exuberance, pointing specifically to frothy valuations around artificial intelligence and the infrastructure buildout behind it. His choice of words was deliberate. Strategists at Panmure Liberum estimated around the same time that the AI boom is approximately 60% larger than the dot-com bubble by valuation metrics. The Shiller CAPE ratio for the S&P 500 has remained above 38, a level exceeded only twice in the past century: during the late 1990s dot-com run and briefly in late 2021.
At the same time, the Roundhill Magnificent Seven ETF is down approximately 8% in June 2026 alone, while Industrials, Energy, and Materials have outperformed the broader market by a wide margin year-to-date. The current macro and energy environment has accelerated that rotation. The market is already moving out of the most speculative AI names toward real-economy sectors. That rotation is not a crash. But it echoes the late-stage pattern that preceded the dot-com peak.
None of this means the correction is imminent. That is precisely the problem. Greenspan made his warning when the S&P 500 had already risen nearly 60% in the prior two years. It ran another 105% before his diagnosis was vindicated.
Why Do Bubble Warnings Consistently Fail as Sell Signals?
Bubble warnings fail as sell signals because the gap between a correct diagnosis and market confirmation can span years — and that gap has a compounding dollar cost.
The CAPE ratio has signaled equity overvaluation for most of the past decade. Investors who reduced equity exposure in 2016 when the ratio first broke above its prior range missed more than 200% in S&P 500 returns before the next meaningful correction arrived. Grantham, one of the most rigorous bubble diagnosticians in institutional finance, called a super-bubble in late 2021. The market ran another 30% before reversing.
“I feel stuck sitting in t-bills,” one investor wrote to financial analyst Ben Carlson in May 2025, explaining that they had gone to cash expecting a crash that did not materialize. “I assumed things would get a lot worse before they got better and I would have plenty of time to buy.” The market recovered while they waited.
This is not an isolated psychology. It is the modal outcome for investors who act on bubble warnings. Morningstar’s 2026 analysis of the prior year’s volatility found that investors who sold equities during the tariff-driven turbulence of 2025 missed the market’s subsequent strong recovery. VOO returned 17.9% over the period. Retail investors tend to underperform the very funds they invest in because they buy after periods of strong performance and sell after periods of poor performance.
The mechanism is not mysterious. Bubbles are sustained by momentum, narrative, and liquidity. All three must break simultaneously before a stock market bubble resolves. No single indicator reliably predicts when that convergence happens, which is why every bubble warning in history has looked both prescient in retrospect and poorly timed at the moment it was issued.
What Does the Historical Data Say About Staying Invested Through a Bubble?
Investors who maintained contributions through the last two major bubble cycles significantly outperformed those who reduced exposure on valuation warnings — in approximately 70% of historical periods.
The historical record is clear on one point. Investors who kept automated, consistent contributions running through the last two major bubble cycles, including through their peaks, significantly outperformed investors who reduced exposure on valuation warnings. In approximately 70% of historical periods, buying consistently regardless of valuation signals produced better outcomes than waiting for a correction that felt overdue.
For investors building wealth over a long time horizon, this data argues against treating a stock market bubble warning as a sell signal. The opportunity cost of being wrong about timing compounds quickly. For a data-driven look at what the historical record actually says about when to buy and when to wait, Nick Maggiulli’s Just Keep Buying is the most rigorous treatment available to retail investors.

What Should Investors Actually Do If They Think the Market Is in a Bubble Right Now?
The correct response to a stock market bubble is not binary. The historical record supports neither a full exit nor unconditional inaction — and the right answer depends almost entirely on time horizon.
The choice between selling everything or holding everything is where most investors go wrong. The historical record supports neither extreme.

For investors in the accumulation phase with 15 or more years before they need the money, the data argues for keeping contribution schedules automated and unchanged. Valuation signals do not override the contribution schedule. The long time horizon absorbs bubble cycles the same way it absorbs recessions: through continued compounding rather than tactical exits. A look at which asset classes have historically held up during rate-driven rotations is more useful than a market-timing decision at this stage.
For investors with a heavy concentration in the AI-heavy Nasdaq or Magnificent Seven index funds, a modest reallocation of 5 to 10 percentage points toward international equities, real assets, or defensive sectors is not market timing. It is regime-aware portfolio construction. It does not require predicting the exact top. It requires acknowledging that a portfolio built primarily on one narrow market narrative carries more concentration risk than a diversified allocation.
For pre-retirees within five years of drawing down their portfolios, the calculus is structurally different. A 50% drawdown in the first year of retirement followed by a decade of flat returns is not a recoverable event on a 30-year withdrawal plan. Sequence-of-returns risk means the same bubble warning that a 35-year-old can rationally ignore is the warning a 62-year-old cannot afford to dismiss. The correct move is not to exit equities categorically but to ensure two years of living expenses are held in stable assets before any bubble concern reaches a decision point. That buffer insulates the equity portfolio from forced liquidation at the worst time. For a closer look at how fixed income fits into that buffer, see how investors are positioning in longer-duration bonds.
“This bubble is uncharted territory for me,” one Bogleheads forum member wrote in October 2025. “Should be exciting.” That posture, curious rather than panicked, invested rather than hiding, describes what the data actually supports for most investors.
The One Question to Answer Before You Do Anything
Before reducing equity exposure on bubble concerns, write down the failure scenario. Assume the market runs 40% higher before the correction arrives. Assign an explicit probability to that outcome. If you cannot assign a number, you do not understand the position well enough to act on it meaningfully.
If the probability of continued appreciation before correction is 40% or higher and your time horizon is 10 years or more, the case for reducing exposure weakens considerably. Size any reduction to the probability, not to the intensity of the fear.
Most investors who acted on bubble warnings over the past decade did not run this exercise. They acted on pattern recognition, headlines, and the uncomfortable feeling that something was wrong. The feeling was often correct. The timing was almost never.
Greenspan had the same feeling in 1996. He was right about the bubble. He was right that it would eventually hurt investors badly. What he could not know, and what no indicator has reliably provided since, is when.
For educational purposes only. Not financial advice. Consult a licensed financial professional before making investment decisions.
Frequently Asked Questions
How long do stock market bubbles typically last after the first warning signs appear?
Historical precedent ranges from months to years. The dot-com bubble was identified publicly in 1996 and peaked in March 2000, more than three years later. The 2006 housing bubble warnings preceded the 2008 collapse by nearly two years. There is no reliable average. The range is wide enough to financially ruin investors who exit too early while waiting for a resolution that takes longer than their patience or income can sustain.
Is the current AI stock market bubble bigger than the dot-com bubble?
By some measures, yes. Institutional strategists have described the AI boom as approximately 60% larger than the dot-com bubble by valuation metrics. However, today’s leading AI companies, unlike dot-com era firms, generate substantial real revenue and profit margins. Goldman Sachs and Morgan Stanley have both argued the comparison is imprecise for that reason. Whether it qualifies as a bubble in the classic sense remains genuinely contested among institutional analysts.
Should I sell my index funds if I think we are in a stock market bubble?
The historical evidence argues against it for most investors. The CAPE ratio has flagged overvaluation for most of the past decade. Investors who reduced index fund exposure in 2016 on that signal missed more than 200% in S&P 500 returns before the next significant correction. The most relevant variable is time horizon. An investor 20 years from retirement and one five years from retirement face structurally different risks from the same bubble environment.
What is the difference between a stock market bubble and a market correction?
A correction is typically defined as a decline of 10% or more from a recent peak and resolves relatively quickly, often within months. A bubble burst involves a sustained decline driven by overvaluation unwinding. The dot-com collapse wiped out 78% of the Nasdaq over nearly three years. The distinction matters for planning: corrections are routine and recoverable; a bubble burst in the wrong sequence, specifically in early retirement, can permanently impair a financial plan.