

I wonder if Fed Chair, Janet Yellen, ever wants to say: “How am I supposed to know what interest rates are going to do?”
As one reviews the current stock and bond markets, it would be natural to think about the concept of “Inflection Point”[1]. I don’t think that many readers would quibble with me if I observed that markets have been a bit peculiar lately. For example:
1) Last week, the Dow, S&P 500, and Russell 2000 all reached new highs… while the NASDAQ leaped upward by 3.14% on its continuing quest to overtake its former all-time high.
2) And yet, despite this seeming bullish behavior, Charles Biderman (Trim Tabs Investment Research CEO and manager of TrimTabs Float Shrink ETF (TTFS)) observed that market leadership has lately been anemic… with ever fewer stocks reaching new highs.
3) More specifically, Barron’s published a startling statistic:
a) The S&P 500 (in aggregate) has just reported Year-Over-Year (YoY) earnings growth of 4.1%.
b) However (alas) one-half of that aggregate gain was produced by one single company –Apple Inc. (AAPL).
c) Therefore, Barron’s pointed out that the “S&P 499” (not including AAPL) only generated earnings growth approximating 2% (YoY).
4) Market historians know that one symptom of a potential “Market Top” is a narrowing of market leadership such as we’ve been seeing!
a) NOTE: That does not mean we are at a market top. But it can serve as a “yellow light” warning investors to be wary.
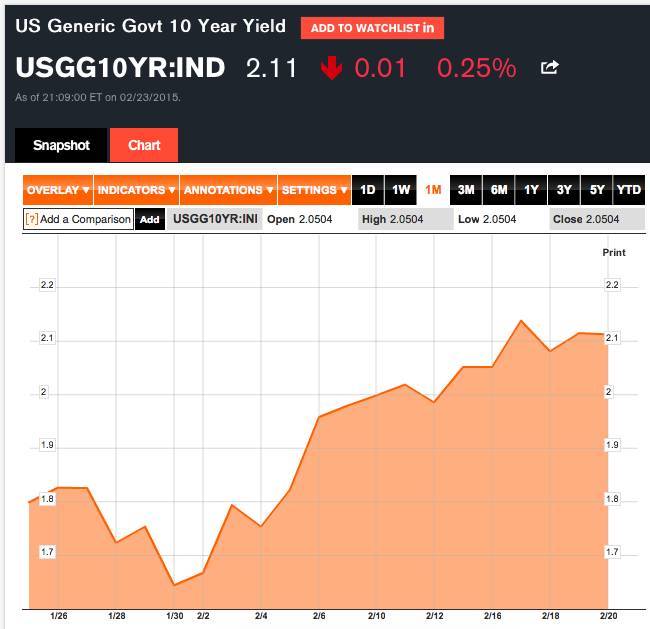
Well, wouldn’t that “symptom” serve as a hint that bonds would be a great place within which to invest one’s funds? Under normal circumstances, that would be the case. However, after descending downward between December and late January at the fastest clip since August of 2011 – reaching a yield of 1.64% (a level that practically no one had predicted) –
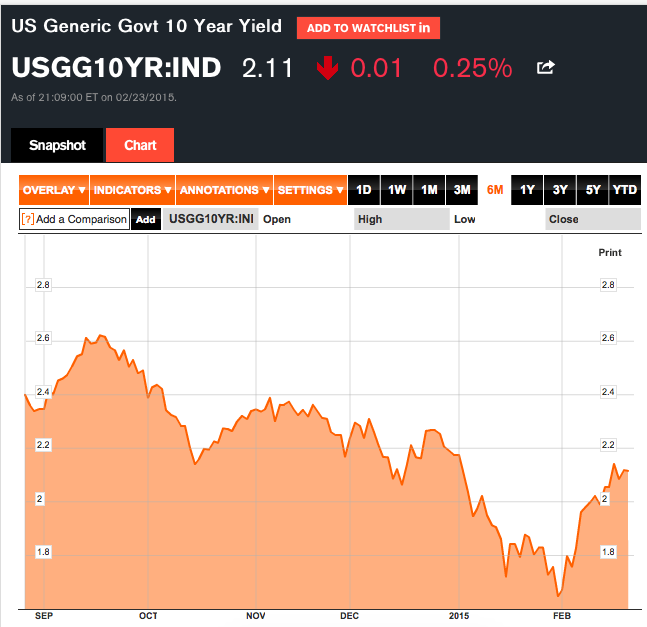
the interest rate on the 10-Year U.S. Treasury Note actually managed to climb back up over2.10%. So since bond prices move inversely to bond yields, anyone invested in 10-years since February 1st would have suffered a loss!! Hardly an optimum return!
Why are we getting these contrary “signs” from the “Market”? Well, the flippant answer is that “Ms. Market” prefers that no one really ever knows for sure what her intentions might be! She likes keeping us variously befuddled, beguiled, beleaguered, and/or bedeviled.
But a more serious response would be: unprecedented central bank monetary policy around the world has leant new meaning to the hackneyed phrase: “this time it’s different!” Central banks have unloosed a flood of “liquidity” into global economies (and markets) unlike ever seen before. That doesn’t mean that time tested economic and investment principles should be ignored. But it does mean that we must be ever prepared for the unpredicted and unexpected… as well as theirrational.
Here are two cases in point:
1) While the U.S. Ten-Year Note yields over 2%, ten year notes from Spain yield 1.55% and those from Italy yield 1.61%. [What sort of “Twilight Zone” world are we in?]
2) Remembering that Sweden is the home of the vaunted Nobel Prize (recognized as an indicative of intellectual and creative genius) it took me aback to learn that the folks guiding the Riksbank (the nation’s central bank)

have thrown in the towel and joined the rush toward “QE” (cut its benchmark rate to -.10% and started an asset purchase program to stimulate economic activity). Yikes!

The above notwithstanding, if one focuses upon ETF Fund Flows since January 1st, there is an interesting and mildly surprising trend taking shape. The world’s largest provider of mutual funds and ETFs announced in mid February that the U.S. fixed income ETF space is enjoying its fastest ever beginning of the year start!
According to mammoth BlackRock Inc. investors sent over $19.6 billion into U.S. fixed income ETFs between January 1st and February 12th! Of course, BlackRock was proud to declare that over 62% of those funds ($12.2 billion) were directed into it’s own ETFs… highlighted by:
1) The iShares iBoxx High Yield Corporate Bond ETF (HYG) – received $2.4 billion during those first six weeks, more than any other fixed income ETF; and
2) The iShares Barclays Short Treasury Bond ETF (SHV) – received only a bit less, taking in $2.2 billion.
It should be no surprise that SHV was so popular (we referred to it in our most recent prior article). Its low duration reduces its interest rate risk (the risk of price deterioration as interest rates rise). And that is appealing because, once again, weekly (often daily) speculation within the U.S. financial press is focused upon the seeming certainty that the U.S. Federal Reserve will be increasing rates soon (June seems to be the guess most often bandied about).
However, in an environment that often appears to be slanted toward “lowered risk” (hence global flight toward the U.S. Dollar), it seems counter-intuitive that HYG would pull in more assets than any other fixed income ETF.
Through the second half of 2014, high yield bonds were under pressure because:
1) Investor demand for higher rates in a our Zero Interest Rate (ZIRP) world had pushed high yield into overbought territory (the “spread” between low risk U.S. Treasuries and high yield bonds fell to range that no longer compensated investors for relative risk).
2) Since the advent of the U.S. shale oil boom, one of the most frequent issuers of high-yield debt have been smaller shale oil/fracking firms[2]. When the bottom fell out of the price of oil, that dislocation raised fears of widespread defaults in the space – putting pressure on those high yield ETFs with higher exposure to these companies.
a) Particularly vulnerable were the shares of AdvisorShares Peritus High Yield ETF (HYLD) – an actively managed fixed income ETF that specializes in intensive research to ferret out undervalued high-yield bonds in the secondary market from higher quality firms.
b) To the misfortune of managers and shareholders alike, HYLD was particularly stung during the last six months of 2014 because it had exposure of nearly 20% to various elements of the oil space.

However, with the dawn of 2015 and the (for however long or short) stabilization of oil prices above $44/barrel, so called “junk bonds” have become the best performing fixed income asset…. and consequently have been generally “net positive” in funds flows week after week.
Most experts will grant that risk remains inherent in the high-yield space due to the (as yet) uncertainties we face regarding future oil price dynamics. However, analysts at Goldman Sachs (GS) have stepped up to opine that the actual risks are not as great as the market appears to think they are:
“…high-yield exploration and production [companies] will prove surprisingly resilient in their ability to weather low oil prices without large-scale defaults.”
In fact, the Goldman analysts believe that the longer-range impact on high yield bonds from the plunge of oil will be “transitory.” Goldman suggests that most exploration and high-yield exploration companies have relatively low “re-financing risk because (on average) less than ten percent of total issued debt will be maturing before 2018 – therefore making default risk “benign”.[3]
Reflecting much the same perspective, one portfolio manager at Western Asset suggests that for those able to discern likely survivors from the weaker, more vulnerable bond issuers: “there is tremendous opportunity in energy high-yield.”
In case investing in high-yield bonds sounds too risky for you, consider this analysis, which I have adapted from a report issued by AdvisorShares[4].
It is wise to keep in mind that the markets are “forward-looking”, meaning investors attempt to anticipate the investment landscape as it will be in about six months. Therefore, players have already started to “price in” what they expect the FED to do with rates in June (or thereafter). That is part of the dynamic impacting TLT since February 1st. Investors also need to keep in mind the differences among bond instruments vis-a-via their sensitivity to rate increases. Specifically:
1) U.S. Treasuries will feel a greater relative impact than corporates;
2) Longer-term bonds will be impacted more significantly than shorter-term bonds.
In fact, there is a helpful metric that can serve investors well as a too with which to compare interest rate sensitivity across different forms of bond securities. That measure of rate sensitivity is called “Duration” – which is a calculation of the expected price change for any given bond in reaction to any given change in interest rates![5] Duration is expressed in years, and since bond prices move in the opposite direction of rates, the higher the duration number of any given bond is, the greater will be its price decline as rates move upward.
As I noted, by using “Duration” one can compare bonds across different categories within the fixed income space. For example, review the following chart of “Duration” and “Yield” for the following:U.S. 5-Year Treasury Note; Barclays Municipal Bond Index; Barclays Corporate Investment Grade; and Barclays U.S. Corporate High Yield.
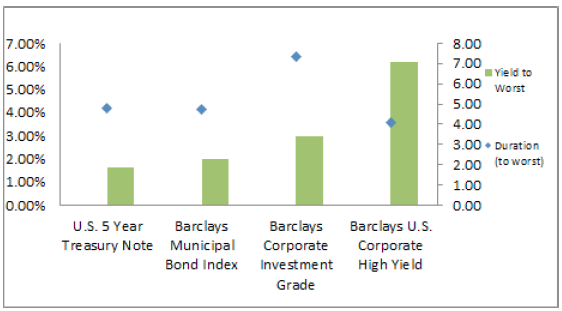
The green bars represent a “Yield to Worst” for that bond category, while the blue diamondsindicate that category’s “Duration (to worst)”.
Do the metrics surprise you? The High-Yield category has the shortest duration and the (by far)highest yield. Duration for the Treasury Notes and Muni Bonds is about 5 years each, while the investment grade bonds show duration of more than 7 years. However, the High-Yield duration is only (approximately) 4 years!
What that means (perhaps counter-intuitively) is that the High-Yield space (as a whole) is significantly less sensitive to rate increases than is the investment-grade corporate space!
Meanwhile, High-Yield offers an average yield over twice that of corporates … and three times higher than Munis or the Treasuries!
I hope it is obvious that when we have access to two well-established metrics for different investment choices within any asset class (fixed income in this case), the optimum course of action is to evaluate those investment choices by reference to both metrics. Therefore we should evaluate choices among these four categories of bonds by reviewing them relative to both Duration and Yield!!
This table lists the bond category investment returns (between 1980 and 2013) for two of these instruments during each of the fifteen years in which interest rates rose during that calendaryear. Note that the far right column shows the degree to which 5-Year Treasury Yields rose during that year (a high of 2.62%; a low of 0.07%).
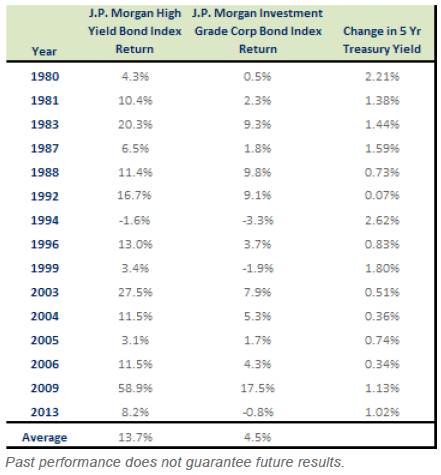
To save you time, allow me to offer an executive summary of the respective returns of investment-grade bonds and high-yield bonds during these 15 years of rising rates:
| BOND CATEGORY | Average return during rate increase years |
| Investment Grade Bond Index |
4.5% |
| High-Yield Bond Index |
13.7% |
| BOND CATEGORY | Average return during rate increase years – EXCLUDING the abnormal bond performance of 2009 |
| Investment Grade Bond Index |
3.6% |
| High-Yield Bond Index |
10.4% |
So… moving to the “Honor System”, if I asked you right now which category of bond you would rather have owned during the 15 years of rising years reported above – what would your answer be?
Just a hunch here… but my instinct is that if I had you all in a classroom and asked you to raise your hand if you would have invested in High-Yield Bonds, I’d see less hands raised than if I asked you to submit your answer in secret (electronically or on paper).
Why? Because the metrics are very clear regarding the superiority of High-Yield returns within a mildly rising rate environment… and yet most of us carry an emotional reaction to the vernacular description of “High-Yield” (ie. “Junk Bonds”) that makes it harder for us to embrace “High-Yield” without reservation!!.
Therefore, consider the following:
1) If during the next 12 months interest rates don’t rise as significantly as many observers are predicting, the much higher yields offered by “High-Yield” bonds will make it very difficult for “Investment-Grade” bonds to catch up vis-à-vis total return!
2) Even if rates DO rise in the range of 1.75% to 2.62% (the higher portion of the range that occurred between 1980 and 2013) – the Duration on “High-Yield” is just over 4 years… while the Duration on “Investment-Grade” is over 7 years. Therefore, the former will respond withless interest rate sensitivity… as well as offer a higher yield!
How does this make sense? It is simple. The biggest risk regarding “High-Yield” bonds is two-fold:
1) Credit rating – that is “risk of default” and
2) Economic downturn – which accentuates the vulnerability of bonds issued by companies with a lower credit rating and less financial strength!!
Expressed in “short-hand”… if/when you believe the U.S. is headed into a Recession, “get the heck out of Dodge” with regard to your “High-Yield” bond allocations!
All of the above being said, if you are intrigued by the possibility of adding “High-Yield” bonds to your portfolio – here is information about three prominent ETF offerings that might whet your appetite:
I) There are two major (mega-sized) “High-Yield” ETFs whose investment mandate is to follow an Index religiously:[6]
A) iShares iBoxx High Yield Corporate Bond ETF (HYG)
B) SPDR Barclays Capital High Yield Bond ETF (JNK)
II) There is one decent sized (but much smaller than HYG and JNK) that is actively-managed… offering managers the flexibility to shop the secondary high-yield market to hunt down under-valued bonds that hold the potential of higher than benchmark returns over time.
A) AdvisorShares Peritus High Yield ETF (HYLD)
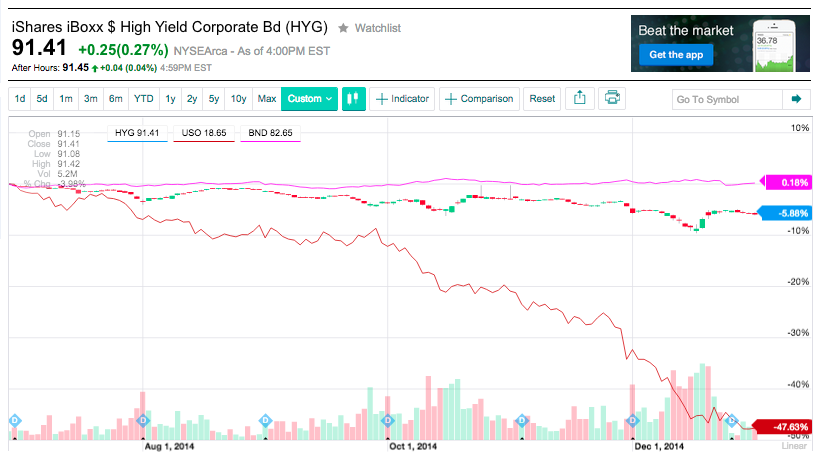
Allow me to speak from personal experience regarding the blessings and perils of actively-managed High-Yield ETFs. I have been a long-term fan of HYLD. I became a disciple of their approach regarding intensive research to discern which secondary market bonds held the brightest prospect of returns that would exceed those of the average High-Yield ETF. For many, many months I was blessed by exceptional returns!
Then (alas) the oil price collapse took hold. Look at this chart from July 1st through December 31stof 2014:
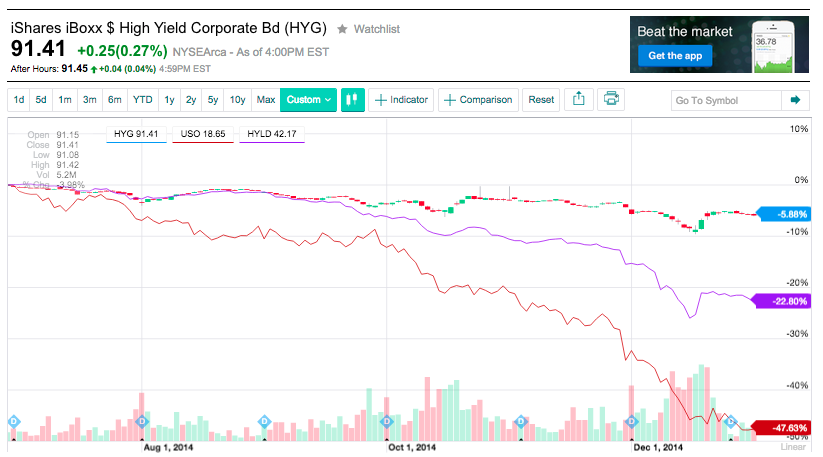
Anyone who knows me well knows that I died with each added 5% loss. I was foolish enough to think that oil’s plunge would stop at $70, then at $60, than at $50. So much for “hope”.[7] I offer that note as a caution to all that anytime the markets experience “dislocation” such as the oil “crash”, unfortunate things can take place! Be careful out there.
INVESTOR TAKEAWAY:
Quantitative Easing seemingly “gone global” notwithstanding, eventually the U.S. Federal Reserve will need to begin raising domestic interest rates. Knowing precisely when they will begin raising rates is far, far beyond my keen!
That leaves each investor with responsibility for discerning what her/his approach to interest rate risk within their portfolio should be. Needless to say, all investors should have as his/her overriding (and ultimate) goal to carry a well-diversified portfolio (equity/bonds/commodities/resources/alternatives, etc.) …. as well as one that is diversified withinseparate asset classes (large cap and small cap equities; domestic and international equities; Treasury, corporate, and high-yield bonds; long-term and short-term bonds; etc.).
Hopefully, the above presentation on Duration and Yield has been helpful. However you interpret this material and whatever you decide to do (if anything) in response to these metrics and observations – please make sure you perform your own due diligence. And as always, remember that: “Past Performance is no assurance of future results!”
In the weeks ahead, we’ll offer insights regarding some other fixed-income ETF instruments – including “Floating Rate ETFs” (a great way to lower high-yield duration even more) and “Negative Duration ETFs”!
DISCLOSURE:
The author owns HYLD, and has owned JNK, and currently owns a position in TLT. Nothing in this article is intended as a recommendation to buy or sell anything. Always consult with your financial advisor regarding changes in your portfolio – either subtractions or additions.
FOOTNOTES:
[1] From en.Wikipedia.org: “In differential calculus, an inflection point, point of inflection, flex, or inflection (inflexion) is a point on a curve at which the curve changes from being concave (ie. downward) to convex (ie. upward)… or vice versa.”
[2] It is well worth noting that, according to global financial giant, Societe Generale, the low interest environment has prompted the entire oil space to collectively increase its borrowing across the debt spectrum, from “bank loans” to corporate debt and high-yield bonds. Currently, $2.5 Trillion of global debt is attributable to the oil industry!

[3] Goldman reports that because of cash and assets on hand, the average high-yield exploration/production company will be able to endure three quarters of WTI Oil prices below $50 per barrel.
[4] Keep in mind that AdvisorShares has an interest in promoting high yield ETFs because it runs the HYLD fund. However, their analysis is based on ascertainable investment dynamics and historical metrics.
[5] As noted in Investopedia.com: “The duration number is a complicated calculation involving present value, yield, coupon, final maturity and call features.”
[6] The advantage of “Index-following” is it is objective….
[7] I am also a lifelong Chicago Cubs fan… doomed to suffer from excessively fanciful “Hope”.