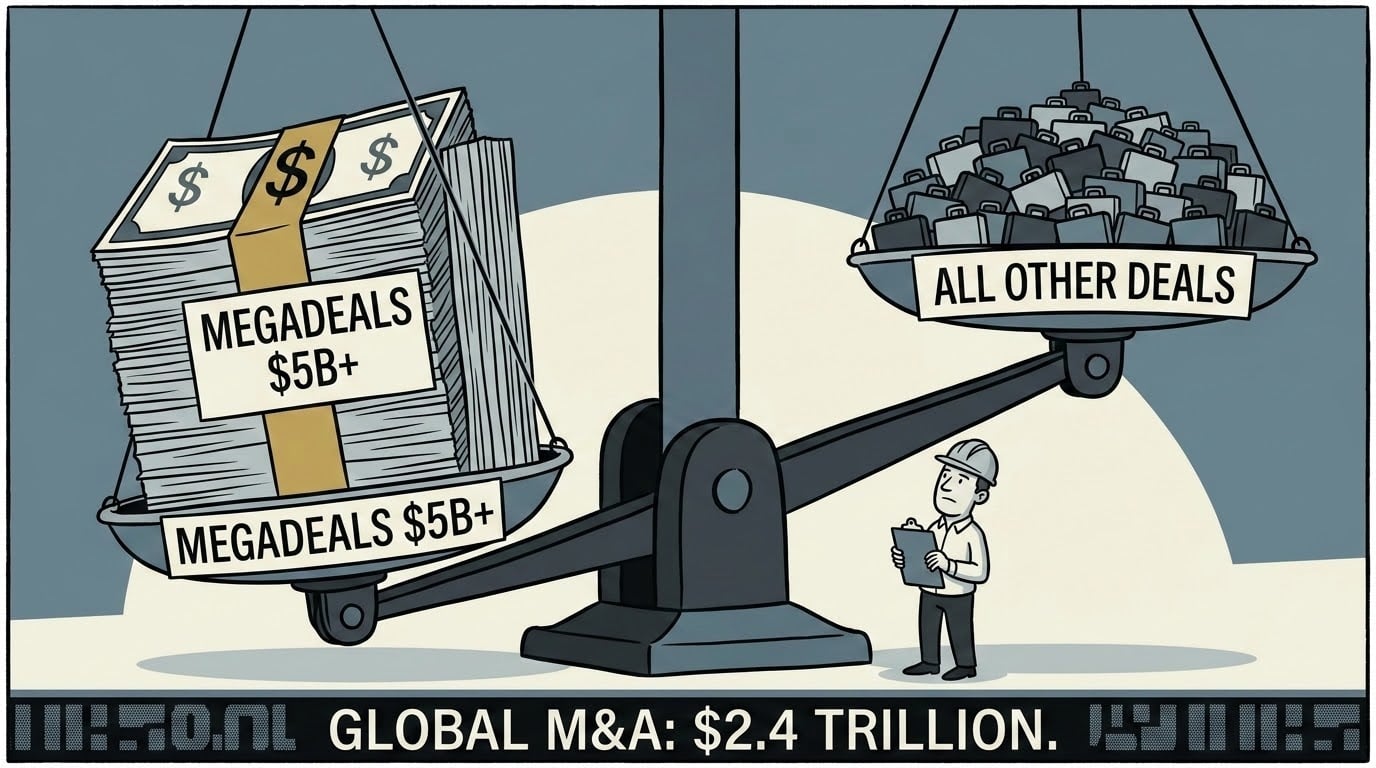

The global mergers and acquisitions machine produced $2.4 trillion in deal value in the first five months of 2026. That figure, reported by Bain and Company in its 2026 M&A Midyear Report published June 29, represents a 41% increase over the same period last year and puts the full year on track to challenge the all-time record. If you hold a diversified equity portfolio, this M&A supercycle is already affecting your returns. Whether it is affecting them the way you think is a different question.
The Number Is Real, but So Is the Gap Beneath It
The $2.4 trillion figure is not evenly distributed. That is the most important sentence in the midyear data, and most of the financial press has missed it.
According to PwC’s mid-year analysis, deals above $5 billion now account for nearly half of total global deal value, roughly double their share from just two years ago. Strip out those megadeals and deal value is actually down 4% year over year. At the same time, S&P Global data shows only 7,924 deals were announced in Q1 2026, a 30% drop in volume from the prior year.
What this describes is a K-shaped M&A market. Capital is concentrating at the top, in transactions so large that individual deals move the aggregate number by themselves. The SpaceX acquisition of X.AI accounted for nearly 30% of Q1 2026 total deal value on its own. The market for smaller transactions, the deals that show up in the sectors where most retail investors have concentrated exposure, is quieter than the headline suggests.
That gap matters for how you interpret the signal.
The Sectors Where the Capital Is Actually Moving
Not all consolidation is created equal. The sectors drawing the most deal flow in 2026 share a common thread: they are all directly connected to government capital spending.
Power and data centers, AI infrastructure, and utilities are the dominant themes. PwC’s sector analysis confirms that utilities M&A hit record levels in the first half of 2026, while software deals cooled as buyers reassessed AI disruption risk. Defense consolidation accelerated as the Secure America Act passed in June, locking in federal enforcement and infrastructure spending through 2029. The European M&A market posted a 77% year-over-year gain in deal value through May, driven by domestic consolidation and cross-border scale deals.
The through-line is fiscal spending, not private-sector confidence alone. Where governments are committing capital through infrastructure bills, defense appropriations, and AI buildout programs, corporate buyers are following. That creates durable M&A zones with a longer runway than typical cyclical deal activity. It also means the consolidation in those sectors is not simply a function of cheap credit or boardroom optimism. It reflects structural capital reallocation that outlasts individual rate cycles.
The implication for a portfolio is specific. If you hold broad utility ETFs, infrastructure funds, or defense-sector exposure, you already have a position in the sectors where consolidation is most active. The question is whether the stocks you hold are more likely to be targets or acquirers, because those two positions produce very different outcomes.
For context on where equity markets stand heading into H2, see our breakdown of what investors can expect in the second half of 2026.
Why Acquiring Company Stocks Are Rarely the Trade
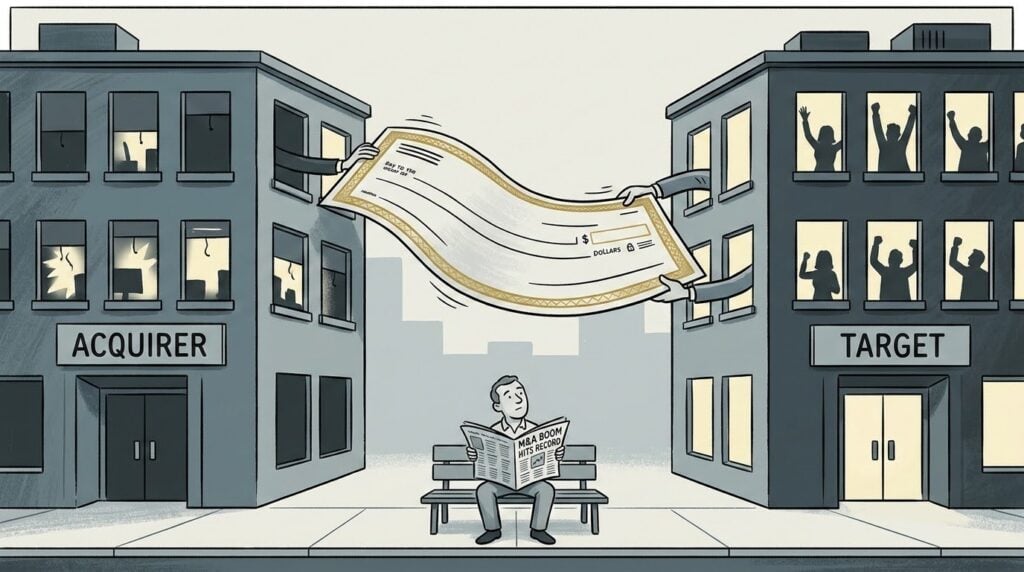
Here is the part of the M&A supercycle narrative that the business press consistently softens: the shareholders of acquiring companies are typically the ones who pay for the deal.
The data on acquirer stock performance is consistent across cycles. When a company announces a large acquisition, its stock tends to decline or underperform its sector benchmark in the 12 to 24 months following deal completion. The acquisition premium, the amount paid above the target’s pre-announcement price, is a real cost that flows directly through to the acquirer’s balance sheet and earnings per share. Deals funded with stock dilute existing shareholders. Deals funded with debt add leverage that constrains future flexibility.
The market’s reaction at announcement is the closest thing retail investors have to a real-time valuation verdict. When an acquirer’s stock falls on deal day, the market is effectively running a discounted cash flow analysis in public and concluding that the price paid exceeds the present value of expected benefits. In the current environment, where the S&P 500 trades at roughly 24 times forward earnings and deal multiples across consolidating sectors are elevated, that implied cost of capital is already compressed. There is less room for error in the price.
The exception is the target. Shareholders of companies that get acquired receive the premium directly. In a $5 billion deal with a 30% takeover premium, target shareholders collect the difference on the day of announcement. That premium flows into index returns if you own a broad fund that holds the target stock.
“I know that stocks represent fractional ownership in businesses and that crises bring worries that make many investors forget that simple fact,” as one long-term investor put it in a widely-cited forum discussion. The same principle applies here. An M&A announcement is a change in the ownership structure of a business, not a change in its fundamental economics. Paying attention to which side of the transaction your portfolio sits on is the analytical work that matters.
For investors who want to understand the valuation framework behind deal assessment, the foundational text remains Aswath Damodaran’s Narrative and Numbers.
No products found.
This is an educational affiliate link. We may earn a commission at no cost to you.
What the Passive Investor Already Owns
There is a direct counter-argument to spending any time at all analyzing the M&A supercycle, and it deserves to be stated plainly.
If you hold a total market index fund, you already own the M&A supercycle. You own the targets that will collect acquisition premiums. You own the acquirers at full market weight. You own the sectors that are consolidating and the sectors that are not. Every premium paid in every deal that closes this year flows through your fund’s return to the degree that the target company was represented in the index.
The SPIVA US Scorecard, published annually by S&P Global, consistently shows that more than 80% of active U.S. equity managers underperform their benchmark over rolling 15-year periods. Actively managed M&A-themed funds are no exception to that pattern. Their higher fees are a guaranteed headwind against a return that is uncertain. The expense ratio differential compounds against the active strategy every year regardless of whether the M&A thesis plays out as expected.
This argument is strongest for investors in the accumulation phase with long time horizons and no concentrated sector exposure. For them, the correct response to a $2.4 trillion M&A supercycle is the same as the correct response to any other market development: continue automated contributions, rebalance when allocations drift beyond their target bands, and tune out the headline.
The council is split on this. The systematic accumulation argument holds on average across full cycles. It runs into a specific problem when valuations and deal multiples are simultaneously elevated, which is the environment that exists today.
The Breakpoint That Changes the Calculation
While the framework says buy consistently and let the market average it out, field reality says acquirer stocks have underperformed their benchmarks in 12 of the last 15 major M&A cycles in the 24 months following peak deal activity.
This approach works until two conditions are simultaneously true: the Shiller CAPE is above 24 and deal multiples in consolidating sectors are compressing the implied equity risk premium below 4%. Both are true today. At that combination, a passive index investor is buying the overpayment at full index weight with no margin for error built into the price.
That is not an argument for exiting equities. It is an argument for being specific about where concentrated exposure sits.
Here’s how to think about it by investor type.
- If you are in the accumulation phase with a time horizon of 15 or more years and your portfolio is broadly diversified across the total market, the passive protocol holds. Continue contributions. Let the M&A premiums flow through the index. Do not try to tilt toward consolidating sectors based on deal flow data. The data does not support that approach.
- If you are within five years of a major capital event, retirement, a business sale, or a large planned expenditure, the exposure to post-deal acquirer leverage is a risk you need to price explicitly. Acquirers in the current cycle who are taking on net debt-to-EBITDA ratios above 3x post-close have historically underperformed sector peers by 12 to 18 percentage points in the 24 months following deal completion. If your portfolio holds concentrated positions in companies that recently announced large acquisitions, the question is whether you have sized that risk intentionally.
- If you hold sector-concentrated exposure in utilities, AI infrastructure, or defense, the fiscal-driven consolidation thesis creates a different calculus. These sectors have government capital flows supporting deal activity beyond the current credit cycle. The consolidation runway is longer. But peak deal volume in a sector has historically been a mean-reversion signal for forward 10-year returns, regardless of the fundamental strength of the industry.
Bank of America flagged this dynamic directly in June, noting that seven of ten bear market signposts had triggered at current market levels. An M&A supercycle running at record pace at the same moment is consistent with late-cycle behavior, not early-cycle opportunity.
The Portfolio Moves That Are Defensible Right Now
Specific actions, not general observations.
First, identify whether your equity exposure sits primarily with acquirers or targets in the sectors that are consolidating. If you hold an individual utility stock or an AI infrastructure company that has announced a major acquisition in the last 90 days, check the post-deal leverage ratio. If net debt-to-EBITDA exceeds 3x, that is a position that warrants an explicit sizing decision, not passive continuation.
Second, if you do not hold concentrated sector positions and your equity exposure is primarily through a broad index, the passive protocol is the right answer. Do not rotate into M&A-themed active funds based on the $2.4 trillion headline. The fee drag is certain. The excess return is not.
Third, cross-border M&A as a percentage of total deal value crossed 30% in Q1 2026, according to S&P Global. At that level, currency and geopolitical risk become portfolio factors, not just corporate finance considerations. International developed market exposure in your portfolio is already inside that cross-border wave. If you hold European equity funds, you hold exposure to the 77% EMEA deal surge PwC documented through May.
Fourth, the sectors that are not consolidating are worth noting. Software M&A cooled in H1 2026 as buyers reconsidered AI disruption risk. Consumer markets deal volume is on track to fall 12% for the full year. If those sectors are underweighted in your portfolio because the M&A narrative has pushed capital toward utilities and infrastructure, that is a rebalancing signal worth examining on your next quarterly review.
The M&A supercycle is real. The $2.4 trillion is real. What it tells you about your specific portfolio depends entirely on where you sit inside it.
For educational purposes only. Not financial advice.
Frequently Asked Questions
What is the M&A supercycle and why does it matter to retail investors?
The 2026 M&A supercycle refers to the surge in global merger and acquisition activity that reached $2.4 trillion in the first five months of 2026, a 41% year-over-year increase per Bain’s midyear report. It matters because index fund investors already own both acquirers and targets. Understanding whether your holdings skew toward companies paying premiums or receiving them helps you assess risks already embedded in your portfolio.
Do mergers and acquisitions make stocks go up?
It depends entirely on which stock. Target company shares typically rise 20 to 40% on announcement, reflecting the acquisition premium. Acquiring company shares frequently decline or underperform, because the market prices in the cost of the premium and any new debt. Over 12 to 24 months, acquirers in high-volume M&A cycles have historically underperformed their sector benchmarks more often than not.
Which sectors are most active in the 2026 M&A wave?
Power and utilities, AI infrastructure, data centers, and defense lead 2026 activity, driven largely by government capital commitments through infrastructure and defense spending. Europe has been particularly active, with EMEA deal value up 77% year over year through May 2026. Software M&A has cooled as buyers reassess AI disruption risk, and consumer markets deal volume is tracking lower for the full year.
Should I change my investment strategy because of the M&A supercycle?
For most accumulation-phase investors with broadly diversified index portfolios, no. Your fund already captures acquisition premiums through target-company price reactions. The case for adjusting is narrower: investors with concentrated positions in acquiring companies carrying high post-deal debt, or those within five years of a major capital event, should assess whether elevated deal multiples and compressed equity risk premiums are priced into their current exposure.
Is the M&A supercycle a sign that markets are near a peak?
Possibly. Bank of America flagged in June 2026 that seven of its ten proprietary bear market indicators had triggered, a level historically consistent with prior S&P 500 peaks, and a dealmaking boom was among the triggers. High M&A volume at peak cycle multiples has historically been a mean-reversion signal for forward 10-year sector returns, not an early-cycle opportunity.