
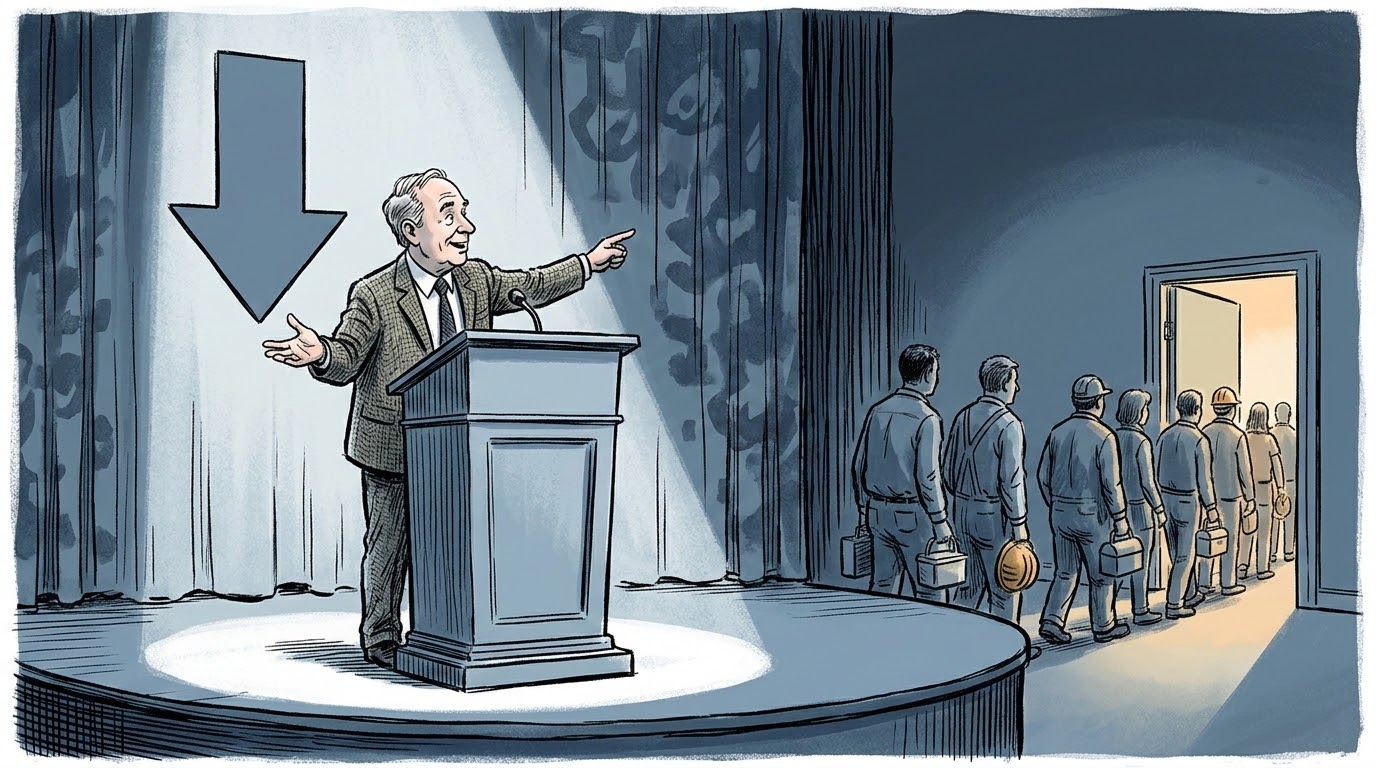

Your pay went up 3.5% over the past year. Average hourly earnings for private nonfarm workers rose 13 cents in June to $37.64, a 0.3% monthly gain and 3.5% over the year, according to the Bureau of Labor Statistics.
Then, prices went up 4.2%.
Let me repeat that: Pay rose 3.5% over the year. Prices rose 4.2%. That gap is now three months old.
That gap is the whole story. Wages are trailing inflation, with the Consumer Price Index rising 4.2% year over year in May, which economists warn will eventually hamper spending, per Reuters. You did not get a raise. You got a smaller pay cut than the person who got nothing. Underneath that gap sits a weakening labor market, and the number everyone quoted on July 2 is actively hiding it.
The Unemployment Rate Fell Because People Stopped Looking
Here is the headline that ran everywhere. The unemployment rate dropped to 4.2% from 4.3%, its lowest reading in a year.
Here is the mechanism. The labor force plummeted by 720,000 in June, while the ranks of those counted as not in the labor force jumped by 832,000. The establishment survey showed 57,000 jobs added, but the household survey, which counts people actually working, fell by 507,000. CNBC reported that participation slid to 61.5%, the lowest since March 2021, and outside the pandemic, the lowest since June 1976.
The unemployment rate improved because the denominator shrank by 720,000 people.
Glassdoor’s chief economist called it good news for the wrong reasons in comments to Reuters, noting the decline was driven by people leaving rather than by more hiring. The chief economist at Navy Federal Credit Union was blunter, writing that it was shocking to watch 720,000 people stop looking for work while the hospitality sector shed jobs.
Payrolls missed by more than half. Economists polled by Reuters had forecast 110,000. The Labor Department also revised April and May down by a combined 74,000 jobs.
Prime-Age Workers Are the Ones Walking Away
The comfortable explanation is that Boomers are retiring and young people are staying in school. Demographics, not distress.
That explanation does not survive the data.
Prime-age participation, ages 25 to 54, fell 0.6 percentage points to 83.3%.
24/7 Wall St. characterizes that as the second-largest monthly decline since records began in the 1940s, while CNBC describes the resulting level as the lowest since December 2023. The two framings do not contradict each other, but they are not the same claim, and only one of them is a record. What both agree on is the composition. Prime-age participation strips out retirees and students. These are people in their peak earning years, and they do not leave the workforce by choice.
The senior economist for North America at Allianz told CNBC he did not want to reach for the word, then said the numbers are cause for concern anyway. He said the retirement and immigration rationale no longer holds up well against the statistics.
Long-term unemployment tells the same story. Roughly 1.9 million people have been out of work for at least 27 weeks, some 286,000 more than a year ago, holding above 27% of the total jobless. Outside the pandemic, that has not been this high since 2016. Yahoo Finance noted the prime-age drop as the reason the aging-population theory falls apart.
On the Bogleheads forum, one poster laid off in his late forties described a year of searching in which “the prospects of returning to a role in my previous industry seem dimmer than ever.” He is not in the unemployment rate anymore. He is not in the labor force either.
A Weakening Labor Market Is Not the Same as a Collapsing One
Now the part that gets skipped.
Wall Street does not agree that this is a crisis, and the disagreement is not partisan or lazy. It is a real read of the same tape.
Second-quarter payrolls averaged 111,000 per month, against 34,000 in the same quarter last year.
Layoffs remain historically low, and economists estimate the economy needs to create only zero to 50,000 jobs per month to keep pace with working-age population growth. By that yardstick, June cleared the bar.
JPMorgan’s chief U.S. economist told Investing.com’s reaction roundup that the report was not as peppy as the prior three but still points to general health in the labor market. Another economist in the same roundup argued the data should be disregarded outright, because leisure and hospitality could not plausibly print negative during a World Cup, and that revisions higher are coming.
He may be right. Leisure and hospitality shed 61,000 jobs in June, which the BLS attributed to weaker-than-usual seasonal hiring. If the World Cup effect shows up two months late, the ugliest line in the report evaporates.
The chief economist at LPL Financial split the difference, noting that firms are still adding to payrolls while flagging the rising flow of people dropping out of the job market altogether as the concerning trend.
Our editorial standard is to surface this kind of disagreement rather than smooth it. Two credible reads exist, and the honest position is that a single household survey carrying a 74,000 two-month revision cannot settle the argument.
The Fed’s Last Published Thinking Predates the Data

The Federal Reserve released the minutes of its June meeting on Wednesday, July 8, at 2 p.m. ET. It was the first set under Chair Kevin Warsh.
Those minutes describe a meeting held June 16 and 17. The jobs report landed July 2.
The Fed wrote down its labor market view on June 17. The labor market data landed July 2.
The Fed left its benchmark rate in the 3.50% to 3.75% range last month, but quarterly projections showed policymakers expected to raise borrowing costs this year. That guidance is now anchored to data since revised down by 74,000 jobs.
Warsh has spent his short tenure dismantling forward guidance, which means nothing automatically updates it. InvestorPlace noted that Warsh described the labor market as steady in a public appearance, and twenty-four hours later payrolls missed by more than half.
Markets moved, but not decisively. Reuters put the odds of a September hike at roughly 60%, down from about 75% before the report. Other outlets described a September hike as off the table entirely. The sources do not agree, and we are not going to pretend they do. We covered why the Fed’s missing dot plot leaves investors flying blind when the June decision landed, and laid out what the second half of 2026 looks like from here before this print arrived. This report is the first real test of both.
What a Weakening Labor Market Does to a Portfolio
Here’s how a weakening labor market can affect your investments:
- If your horizon runs past ten years and your contributions are automated, do nothing. A monthly household survey that gets revised by 74,000 in eight weeks is not an allocation signal. Rebalance on your calendar, not on a payroll print. The cost of your funds is the only variable in this article you control.
- If you are within five years of drawing income, the participation trend is your input, not the headline rate. Seven consecutive months of declining participation, arriving while the index sits at record highs, is the exact configuration that makes the first five years of retirement dangerous. This is a case for funding near-term spending out of cash and short-duration Treasuries rather than selling equities into whatever comes next. Broad short-duration Treasury exposure through an instrument like SHY does that job without a forecast attached.
- If your income depends on the labor market itself, meaning you own a business or your earnings are not contractually fixed, the 61,000 jobs lost in leisure and hospitality and the 45,849 announced job cuts in June are demand signals, not portfolio signals. Cash runway is the lever. Allocation is not.
One metric replaces the monthly print for all three. Average the three most recently revised payroll numbers rather than reacting to each initial estimate. April’s 148,000, May’s 129,000, and June’s 57,000 produce a trailing three-month pace of roughly 111,000 jobs per month.
The metric that replaces the monthly print is the three-month average on revised numbers, currently about 111,000.
Watch that number. Ignore the one on the ticker.
Reading a cycle from inside it is the hardest thing an investor does, and getting the call right too early is nearly as expensive as missing it entirely, which we walked through in the most expensive mistake in a stock market bubble. Howard Marks spent a career on that problem and wrote the most useful book on it, which is why we keep recommending it as an educational partner resource rather than a market call.


Affiliate disclosure: TheCapitalist.com participates in the Amazon Associates program. If you purchase through this link, we may earn a commission. This never influences our editorial coverage. Recommendations are made on relevance to the subject matter, not affiliate relationships.
Watch the Revisions, Not the Rate
June is the most revision-volatile month on the calendar.
Last June’s reported gain was revised down by 160,000 into a net job loss two months later.
April and May have already given back a combined 74,000. So the honest answer is that we will know in August, not today.
If the July and August revisions cut June further, the participation collapse stops being a curiosity and becomes the story of the year. If June revises up and the World Cup jobs show up late, this was noise, and the people who repositioned around it paid for the privilege.
What does not depend on the revisions is the paycheck. Pay grew 3.5%. Prices grew 4.2%. A weakening labor market does not announce itself with a headline. It shows up at the grocery store first, in the gap between what you earn and what things cost, and it reaches households long before it reaches portfolios.
One Bogleheads poster, working through what a softening economy meant for his own plan, wrote that he would love to erase the financial worries aspect of his mental bandwidth. Nobody gets to do that. What you get instead is the ability to read the number correctly, which is worth more than a forecast.
For educational purposes only. Not financial advice. Consult a licensed financial professional before making investment decisions.
Frequently Asked Questions
Why did the unemployment rate fall if hiring slowed down?
The unemployment rate fell to 4.2% because 720,000 people left the labor force entirely, which shrinks the pool of people counted as unemployed. Household employment actually declined by 507,000 in the same month.
What is the labor force participation rate telling investors right now?
It fell to 61.5%, the lowest level since March 2021 and, excluding the pandemic, the lowest since 1976. It has now declined for seven consecutive months, which makes it a trend rather than a monthly artifact.
Are wages actually falling behind inflation?
Yes, on a real basis. Average hourly earnings rose 3.5% over the year through June, while the Consumer Price Index rose 4.2% year over year in May. That is a third straight month of negative real wage growth.
Will the Federal Reserve cut rates because of this report?
Not likely in the near term. The Fed held its benchmark rate at 3.50% to 3.75% in June, and its own projections still showed policymakers expecting to raise rates this year. Market-implied odds of a September hike fell after the report but did not disappear.