
Three months ago, the consensus on Wall Street was simple: the Fed was done tightening, rates were heading lower, and the question was only how many cuts were coming before December. That consensus is gone. Which means as far as the stock market outlook is concerned for the rest of the year, it’s a whole new ball game.
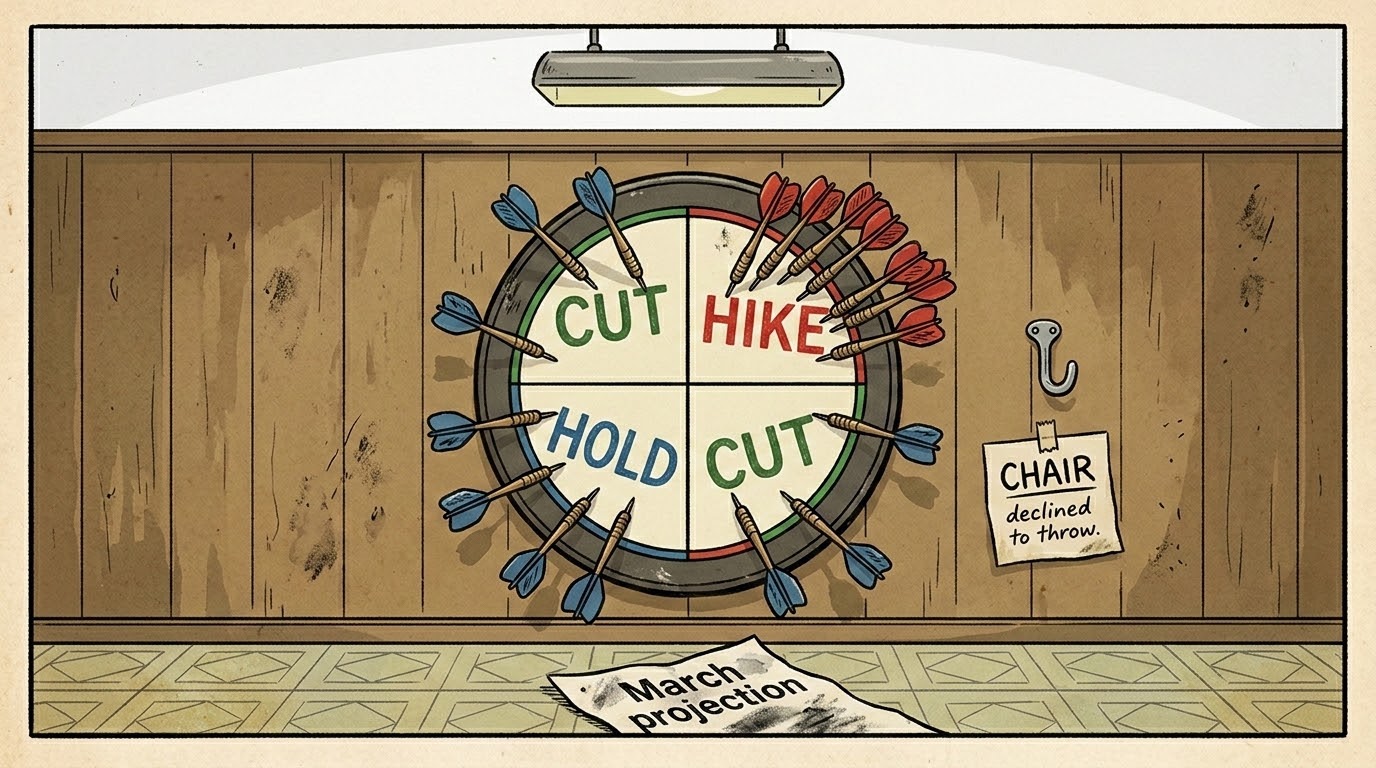
On June 17, the Federal Open Market Committee held the federal funds rate at 3.50% to 3.75% for the fourth consecutive meeting. That part was expected. What was not expected was the dot plot that came with it. Nine of the 18 officials who submitted projections now see at least one rate hike before the end of 2026. Six of those nine see two hikes. The median year-end rate projection jumped from 3.4% in March to 3.8% in June. In a single quarter, the Fed went from signaling a cut to signaling a tightening. The other nine officials projected rates at or below current levels, meaning the committee is evenly split, and the chair declined to break the tie.
New Chair Kevin Warsh did not submit his own projection, consistent with his long-stated skepticism of forward guidance. He did say one thing clearly at the press conference: the committee is “unambiguous and unanimous” in its commitment to price stability. That is not the language of a central bank preparing to ease.
The stock market outlook for the second half of 2026 now runs through three questions. How persistent is inflation? How durable are corporate earnings? And what does your time horizon tell you to do about any of it?
The Stock Market Outlook Starts With 3 Numbers From the Fed
The dot plot shifted from projecting a cut to projecting a hike in a single quarter — the most abrupt reversal in the Fed’s rate guidance since the 2022 tightening cycle.
- The first number is 3.6%. That is the Fed’s revised median forecast for Personal Consumption Expenditures inflation at year-end 2026, up from 2.7% in March. Core PCE, which strips out food and energy, was revised to 3.3% from 2.7%. Both remain well above the Fed’s 2% target. The Iran conflict drove much of the upward revision through elevated energy prices, but the committee’s own language suggests they now believe the pressure is more than temporary.
- The second number is 3.8%. That is where the dot plot median now sits for the federal funds rate at year-end. Futures markets have already responded: traders are currently pricing in a 25-basis-point hike at the October 28 FOMC meeting. That is not a forecast. It is what the market is paying for right now.
- The third number is 4.2%. That is where the Consumer Price Index ran year-over-year in May. The Fed’s preferred inflation gauge and the headline CPI are telling the same story: price pressures have not broken.
These three numbers reframe the second half of 2026. It is not a pause environment. It is a conditional hold with a known trip wire. May PCE data, due June 25, is the first test of whether that trip wire gets closer.
Why the S&P 500 Is Near All-Time Highs Anyway
Earnings growth is holding the market up. Whether it keeps doing so is the central question for anybody asking about the stock market outlook for the second half.
If the rate-cut trade is dead, why is the S&P 500 still sitting near record territory?
The answer is earnings. According to FactSet’s Q2 2026 Earnings Insight, the S&P 500 is projected to report year-over-year earnings growth of 22.0% for the second quarter, the second consecutive quarter above 20% and the seventh straight quarter of double-digit growth. Net profit margins tracked at 14.7% through the first quarter, the highest level on record. Those are not numbers that typically accompany a market rolling over.
The broadening of AI-related capital spending is part of the explanation. The infrastructure build-out has moved beyond a handful of mega-cap technology companies into power, semiconductors, and logistics. That diffusion means more sectors of the S&P are participating in the earnings story, which tends to extend bull markets rather than narrow them.
As BlackRock’s Investment Institute put it in its most recent weekly commentary, published June 15, 2026, “the challenge for investors is that earnings growth and interest rates are rising at the same time.” Technology shares have so far outrun the drag from higher rates because earnings growth has been strong enough to justify the multiple. Whether that continues depends on whether the earnings thesis survives the second half intact.
The June FOMC decision is the macro frame. The earnings season starting this week is where that frame gets tested against actual corporate results.
This Week’s Earnings Are the First Real Data Point
Micron on June 24 and May PCE on June 25 will tell investors more about the stock market outlook in the second half than any Fed statement has.
The June 24 Micron earnings report is the most consequential single print of the week. Analysts expect revenue around $34.5 to $34.8 billion, with the market focused on high-bandwidth memory demand tied to Nvidia’s Vera Rubin platform and whether sold-out HBM capacity is driving gross margin expansion above 80%. Micron is not just a semiconductor story. It is a direct read on whether the AI infrastructure buildout is still accelerating or beginning to plateau.
FedEx reports in the same window. As a freight and logistics bellwether, FedEx gives visibility into consumer spending and supply chain velocity that the headline index numbers do not. A weak FedEx print alongside a strong Micron result tells a more complicated story about which parts of the economy are actually holding.
May PCE data arrives June 25. This is the number the Fed has already told markets it is watching. If it comes in above expectations, the October hike probability moves higher. If it surprises to the downside, the dot plot’s hawkish tilt gets complicated. Either way, the market will have a cleaner read on the second-half trajectory before the end of this week than it does today.
The Dot Plot Is Not the Same Signal for Every Investor
Your time horizon determines whether the June dot plot shift changes anything you should actually do.
The honest answer is that the right response depends almost entirely on where you are in your investing timeline.
- If you are in the accumulation phase with a decade or more before you need the money, the data on this is not ambiguous. Investors who reduced equity exposure at hawkish Fed pivots and then failed to reinvest at the right moment have consistently underperformed those who stayed put. The behavioral cost of acting on macro signals tends to exceed the portfolio benefit of being correct about them. Do not make your investment decisions based on a dot plot the same way you should not make them based on geopolitics. The discipline of staying invested is the edge, not the ability to read the Fed correctly.
- If you are within three to five years of retirement, or if your portfolio is concentrated in high-multiple growth equities, the calculus is different. The S&P 500 is trading at roughly 20.9 times forward earnings, according to FactSet — above both the five-year average of 19.9 and the ten-year average of 18.9. The equity risk premium, which measures how much excess return stocks offer over risk-free bonds, is compressed at exactly the moment rate risk is elevated. That is not a catastrophic setup, but it is one where sequence-of-returns risk becomes material. A portfolio that loses 20% in 2027 and then recovers fully in 2029 is a very different outcome for a 63-year-old than it is for a 43-year-old.
The portfolio moves that make sense in this environment are not dramatic. For rate-sensitive income positions, the dividend landscape has already been reshaped by the dot plot shift. For long-duration growth exposure, the compressed equity risk premium is the signal worth monitoring as PCE data comes in over the summer. For everyone else, the earnings season starting this week is the better guide than the dot plot: if corporate America confirms the growth thesis, the bull market has reasons to extend. If it doesn’t, the macro headwinds will matter more.
For investors who want a data-driven framework for when to act and when to hold, regardless of market conditions, Just Keep Buying by Nick Maggiulli is the most rigorous treatment of why consistent accumulation outperforms reactive allocation across nearly every historical period.

For educational purposes only. Not financial advice.
Frequently Asked Questions
What did the Fed’s June 2026 dot plot actually signal?
Nine of 18 FOMC officials now project at least one rate hike before year-end 2026, up from zero hike projections in March. The median year-end rate forecast moved from 3.4% to 3.8% in a single quarter. New Fed Chair Kevin Warsh did not submit his own projection but emphasized the committee’s commitment to price stability. Futures markets are pricing a 25-basis-point hike at the October 28 meeting.
Why is the S&P 500 near all-time highs if a rate hike is coming?
Corporate earnings growth is the primary support, running near 22% to 23% year-over-year for 2026. Net profit margins are at record levels. As long as earnings growth exceeds the drag from higher rates, equities can hold elevated valuations. The risk is that the margin of outperformance narrows if inflation stays sticky and the October hike materializes.
Should I change my portfolio because of the dot plot shift?
It depends on your time horizon. Investors with 10 or more years before needing the money have a strong historical case for staying invested regardless of Fed signaling. Investors within three to five years of retirement or those with concentrated high-multiple growth exposure face real sequence-of-returns risk that the current rate environment makes harder to absorb. The compressed equity risk premium at elevated valuations is worth reviewing with a financial professional if you are in that window.
What economic data can shape the stock market outlook in the second half of 2026 the most?
Three data points will shape the second half more than anything else. May PCE inflation, due June 25, is the Fed’s own trip wire for the October decision. Micron’s June 24 earnings report is the cleanest read on whether AI infrastructure spending is still accelerating. And the broader Q2 earnings season running through July will confirm or challenge the earnings growth thesis that is currently holding the S&P near record levels.