
Unsurprisingly, the United States Federal Reserve held rates steady on Wednesday. That was the part everyone expected. The Fed rate hike outlook shifted dramatically on Wednesday, and for investors who have spent the last 18 months waiting for cuts to arrive, the timing could not be more consequential.
What no one fully priced in was the three-paragraph policy statement, the stripped-out forward guidance, and a dot plot that moved so sharply the bond market spent the rest of the afternoon repricing everything it thought it knew. For retail investors who have spent the last 18 months waiting for rate cuts to arrive and goose their portfolios, Wednesday was the moment that stopped the clock.
Fed Rate Hike Outlook: The Statement That Changed Everything
The Federal Open Market Committee voted unanimously to keep the federal funds rate at 3.5%–3.75%, its fourth consecutive hold since the 75 basis points of cuts in late 2025. The rate itself was not the story.
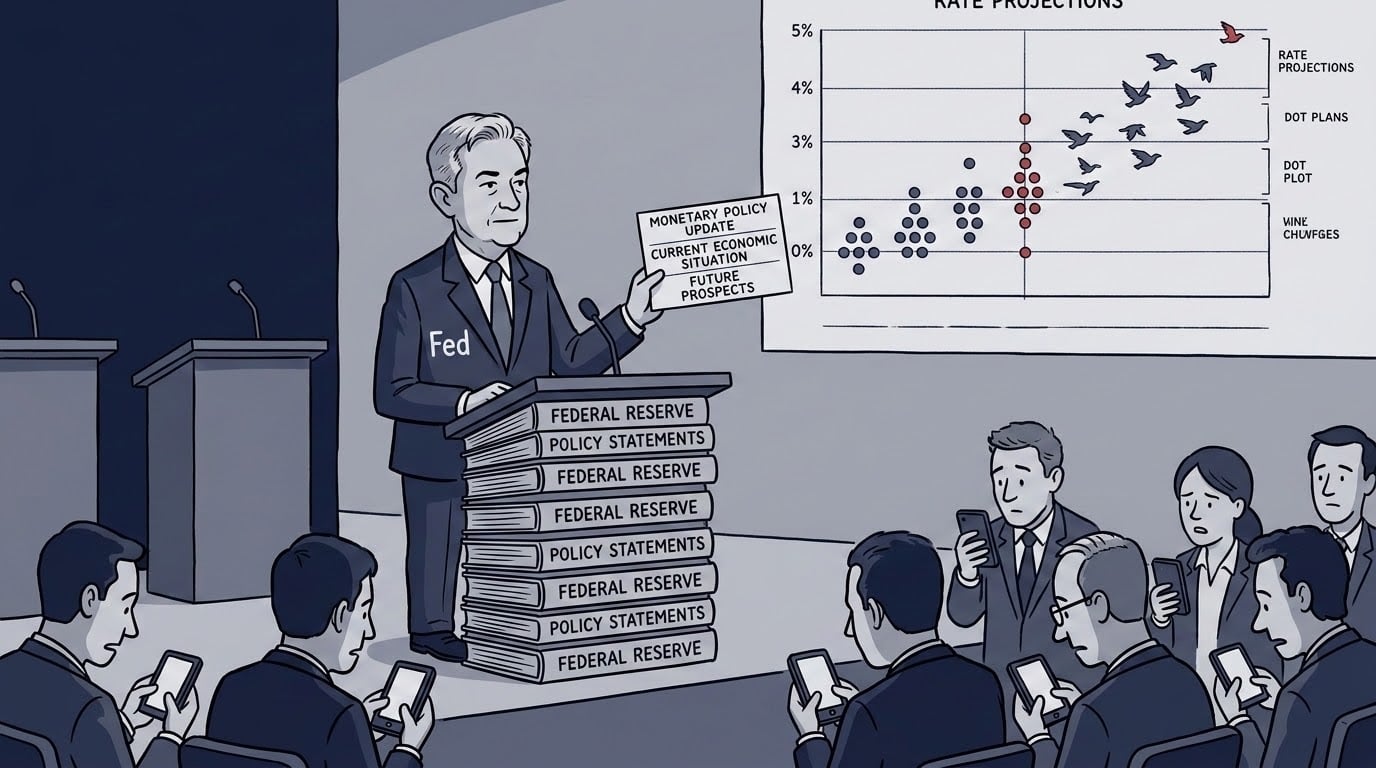
The story was what Kevin Warsh did to the policy statement. Under his predecessor, the statement ran to several paragraphs and included explicit language signaling the committee’s bias toward future easing. Warsh reduced it to roughly 114 words across three paragraphs and removed every reference to future rate adjustments. The statement ended with a single declarative sentence: “The Committee will deliver price stability.”
That is not a soft signal. It is the clearest language a Fed chair has used about inflation in years. Warsh, who served as a Fed governor from 2006 to 2011 and resigned in protest over what he called the small and fleeting benefits of aggressive money printing, did not come to this job to cut rates. Wednesday confirmed it.
He also declined to submit his own dot in the dot plot, citing the early stage of his tenure. Some Fed watchers read that as a sign he objects to the dot plot tool on principle. Others read it as an incoming chair keeping his options open. Either way, markets chose to interpret the whole package as hawkish, and the data supported that interpretation.
What the Dot Plot Is Actually Saying
In March, the median dot plot projection pointed toward at least one cut in 2026, consistent with the path the Fed had been signaling for months. On Wednesday, that projection was erased and replaced with its opposite.
The median year-end 2026 projection moved to 3.8%, up from 3.4% in March. Of the 18 officials who submitted projections, nine now expect at least one rate hike before December. The most hawkish dot sits at 4.5%. The lone cut projection is a single official who sees the funds rate falling 25 basis points.
Prediction markets moved immediately. As of Wednesday evening, Polymarket showed roughly a 66% probability of at least one 25 basis point hike by year-end, with the October meeting leading at 32%.
The inflation context behind those dots: the Consumer Price Index rose 4.2% year-over-year in May, the highest reading since April 2023, driven in large part by energy costs that surged roughly 23.5% following the Iran conflict and disruptions to the Strait of Hormuz. Officials revised their 2026 inflation forecast to 3.6% on headline and 3.3% on core, up from 2.7% for both measures in March.
In plain terms: the typical Fed official now believes rates need to go up before the end of the year, not down. That is a 180-degree turn from where the committee stood six months ago.
Why This Is a Regime Signal, Not Just a Rate Call
The Fed does not need to actually hike rates for this meeting to matter. The signal itself does the repricing.
Start with bonds and stocks moving together. For most of the last 15 years, bonds and equities traded inversely. When stocks fell, bonds rose, and the traditional 60/40 portfolio used that inverse correlation as its primary shock absorber. That correlation has turned positive in inflationary regimes. In 2022, it broke the 60/40 model badly. It is breaking again.
The fiscal backdrop compounds the problem. The federal government is running persistent deficits while the Fed is signaling tighter policy. Historically, that combination of fiscal expansion plus monetary restraint does not resolve cleanly. It compresses growth without eliminating inflation. Investors holding assets priced for a return to 2021 conditions are holding the wrong map.
Goldman Sachs Asset Management’s Kay Haigh called Wednesday’s outcome telling: “Despite the recent pullback in oil, half of the members of the FOMC expect rate hikes as soon as this year, reflecting strong labor market and inflation data.” Goldman’s read is that the hawkish shift is not just about energy prices. The labor market and demand side are providing independent fuel for higher rates. For more on how institutional sell signals have been building in 2026, see our coverage of Bank of America’s recent seven-point bear case.
The forward guidance model itself is now officially under review. Warsh announced five task forces to examine the Fed’s communication strategy, balance sheet policy, data frameworks, productivity in the AI era, and inflation framework. The dot plot may not survive his tenure in its current form. For investors who have spent years reading the tea leaves of Fed communications, that institutional uncertainty is itself a risk factor.
The Fed Rate Hike Outlook: What This Means for Your Bond Portfolio
“For bond investors, this year has brought a rockier ride than many expected,” Fidelity’s midyear bond outlook noted this month, and that was written before Wednesday’s meeting made it worse.
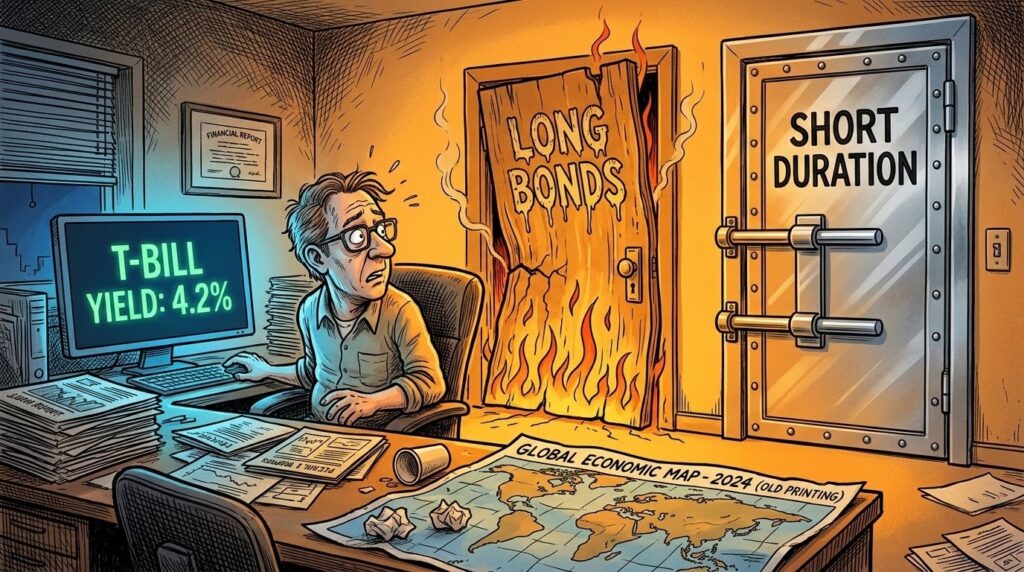
Bond prices and yields move in opposite directions. Investors who loaded into intermediate and long-duration bonds in late 2025 expecting rate cuts to push prices higher are now watching those positions fall. In mid-May, 10-year Treasury yields broke above 4.5% and 30-year yields crossed above 5% for the first time since before the financial crisis. Both moved higher still on Wednesday.
JoAnne Bianco, senior investment strategist at BondBloxx Investment Management, has been direct about what this means: “You are calling it the risk-free rate. It is not risk free. There is a lot of risk associated with this.”
The positioning shift that makes sense in this environment is a reduction in duration, shortening the average maturity of fixed income holdings to reduce sensitivity to further yield increases. Short-term Treasuries (zero to three months) and short-duration bond funds benefit from higher rates rather than suffering from them. New money sitting in long-duration bonds waiting for a cut that may not come is carrying rate risk that no longer has the same return upside to justify it.
Investors who want to put cash to work in fixed income without taking duration risk have a genuine option right now: short-duration Treasuries and money market instruments are yielding meaningfully above zero for the first time in years. That is not a forever position, but it is a rational one while the rate path is this uncertain.
For readers looking to understand the structural mechanics of fixed-income positioning and accumulation-phase investing, Just Keep Buying by Nick Maggiulli (Portfolio/Penguin, 2022) covers how regular investors can think through allocation decisions without overcomplicating them.

For educational purposes only. Not financial advice. The Capitalist participates in affiliate programs and may earn a commission on qualifying purchases.
The Fed Rate Hike Outlook: What This Means for Your Equity Portfolio
The equity picture is more nuanced, but the pressure is real.
The relationship between interest rates and stock valuations runs through the discount rate. When rates rise, future cash flows are worth less in today’s terms, which compresses the valuations of companies priced on distant earnings. High-multiple technology and growth stocks, the leaders of the last several years, are the most exposed to that math.
Wednesday’s market reaction illustrated the divergence clearly. The S&P 500 fell 0.6% on the day. The Nasdaq fell 0.7%. The Russell 2000, which tracks smaller companies more sensitive to domestic borrowing costs, fell an additional 0.6% against the S&P 500’s larger-cap cushion.
The sector that benefits from this environment is financial services. Banks earn wider net interest margins when rates are higher. The gap between what they pay depositors and what they charge borrowers widens, and earnings improve. Insurance companies benefit similarly. The Financial Select Sector SPDR Fund has already been outperforming broader markets as rate hike expectations have built.
The equity risk premium, the extra return investors demand for holding stocks over risk-free Treasuries, is being compressed by rising yields. When the 10-year Treasury was at 1%, holding stocks at a 20x multiple looked reasonable. With the 10-year at 4.47% and rising, that same multiple requires a higher expected return from the business itself to justify the position. Companies that cannot show near-term cash flow generation are structurally at risk of multiple compression.
This does not mean selling equities wholesale. It means scrutinizing what you own and asking a simple question: is this company’s valuation based on earnings that exist now, or earnings projected five to ten years out? The higher the rates go, the harder it is to justify the second category.
When Doing Nothing Is Right, and When It Isn’t
The argument for doing nothing deserves a fair hearing, because history supports it more often than not.
The dot plot has been wrong before. In 2021, the Fed projected rates would stay near zero through 2023. In December 2024, it projected two cuts in 2026. Neither held. Investors who repositioned their entire portfolio around a dot plot projection and were wrong paid for it in transaction costs, tax friction, and the compounding cost of sitting out a rally.
A 30-year-old contributing 15% of income to a diversified index portfolio has no productive action to take based on Wednesday’s meeting. Automated contributions, low fees, broad diversification: those variables matter more to their 2055 outcome than the June 2026 dot plot. “I feel stuck sitting in t-bills,” one investor wrote in a letter to a major financial blog, describing exactly the trap that over-positioning for macro events creates.
The case for inaction breaks down in three specific situations. First, if you hold significant long-duration bond exposure, anything with a maturity beyond 10 years bought in the last 18 months as a cut play. The rationale for that position has been removed. Sitting in it now is not discipline. It is sunk cost reasoning.
Second, if you are within five years of a major liquidity event, retirement, a business sale, or a large planned withdrawal. The sequence-of-returns risk from a sustained higher-rate regime is material. A portfolio that loses 15% in year one of retirement and then recovers does not recover the same way as a portfolio that stays flat. The math on withdrawal rates changes when the first few years are negative.
Third, if your equity portfolio is concentrated in high-multiple growth names whose valuations were explicitly built on a low-rate environment, the discount rate assumption embedded in those positions changed on Wednesday. That is not a macro prediction. It is arithmetic.
The Bottom Line
The Federal Reserve did not hike rates on Wednesday. But it told the market in plain language that it is willing to, that it is not going to signal its moves in advance, and that the institutional posture has changed under a new chair who has spent his career arguing that the Fed prints too much money.
For investors with long-time horizons and diversified holdings, Wednesday is a data point, not a trigger. For investors with long-duration bonds, high-multiple growth stocks, or a retirement date inside the next five years, it is a prompt to review whether the portfolio was built for the conditions that existed six months ago rather than the conditions that exist today.
The Fed stopped cutting. The Fed rate hike outlook now depends entirely on what inflation does between now and October, not on what the dot plot says next quarter.
Frequently Asked Questions
What did the Federal Reserve decide at its June 2026 meeting?
The Fed voted unanimously to hold the federal funds rate at 3.5%–3.75%, its fourth consecutive pause since cutting rates in late 2025. Nine of 18 officials now project at least one rate hike before year-end, and the easing bias was removed from the policy statement.
Who is Kevin Warsh and why does his first meeting matter?
Kevin Warsh became Federal Reserve Chair on May 22, 2026, nominated by President Trump to succeed Jerome Powell. His first meeting rewrote the Fed’s policy statement, removed forward guidance, and delivered a dot plot showing nine officials projecting a 2026 rate hike. It was the first chairman-driven hawkish pivot since the inflation crisis of 2022.
What is the Fed rate hike outlook for the rest of 2026?
As of June 17, 2026, prediction markets showed roughly a 66% probability of at least one 25 basis point hike before year-end. The median dot plot projection puts the fed funds rate at 3.8% by December, implying a single 25 basis point hike from the current 3.5%–3.75% range.
How should investors position their portfolios given the Fed rate hike outlook?
The key variables are time horizon and current holdings. Long-horizon accumulation investors in diversified index funds have no urgent action to take. Investors holding long-duration bonds bought on a rate-cut thesis should assess whether that rationale still holds. Investors with high-multiple growth equity exposure should revisit discount rate assumptions. Anyone within five years of a major liquidity event should evaluate sequence-of-returns risk in a sustained higher-rate environment.