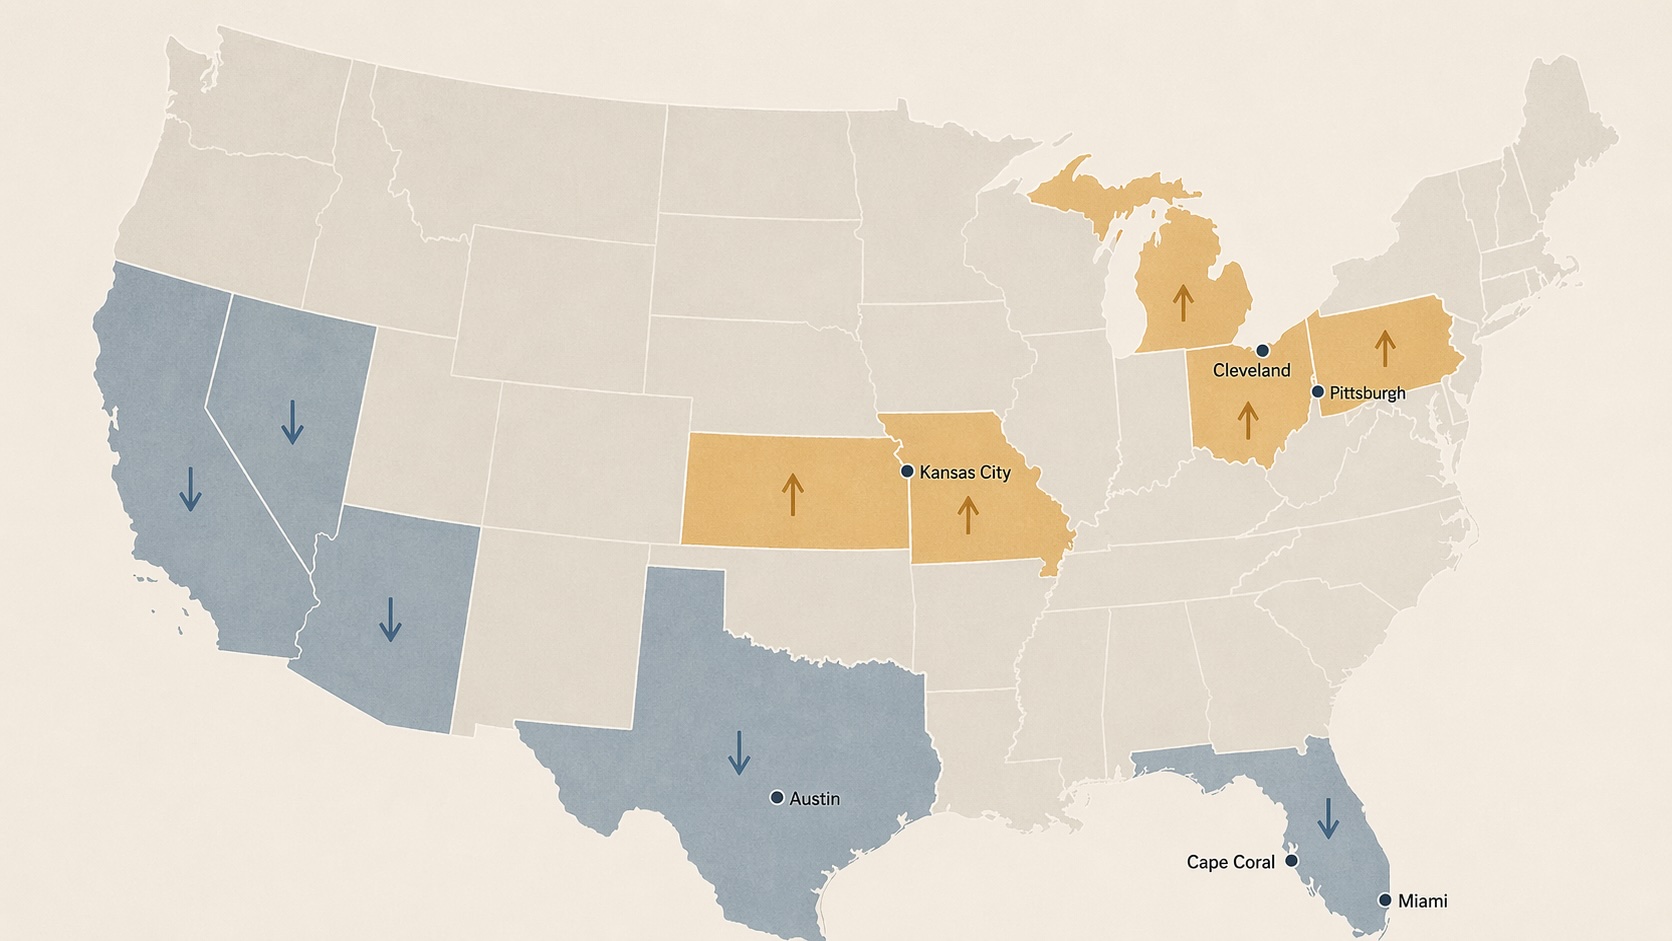

QUICK SUMMARY: AEI Housing Center data through February shows 28 of 53 tracked US metros down year-over-year. Every tracked Florida, California, and Texas metro is in the red. Kansas City is up 8.6 percent, Cleveland 5.9 percent, and Pittsburgh 5.8 percent. Existing home sales in March dropped 3.6 percent. This housing market reversal is not 2008. It is a structural regional repricing driven by conditions that have already reversed.
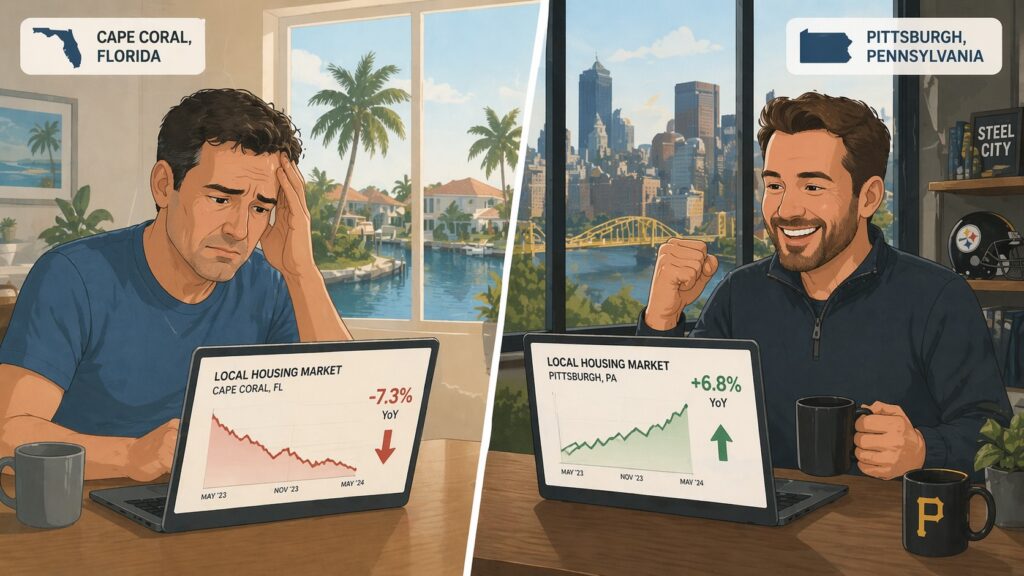
The American Enterprise Institute’s Housing Center released its latest Home Price Appreciation report on April 11, covering data through February 2026. The numbers describe a measurable housing market reversal. 28 of 53 tracked metros now show year-over-year price declines. Every AEI-tracked metro in Florida, California, and Texas is in the minus column. Cape Coral, Florida is down 9.6 percent year-over-year per AEI, with Zillow showing a 4.7 percent decline and Redfin showing 3.8 percent. The three trackers disagree on magnitude but agree on direction. Meanwhile, Rust Belt metros lead national gains: Kansas City is up 8.6 percent, Cleveland up 5.9 percent, Pittsburgh up 5.8 percent. National year-over-year appreciation sits at 1.1 percent, the slowest rate since AEI began tracking these numbers in 2012. March existing home sales dropped 3.6 percent to an annualized rate of 3.98 million. Mortgage rates remain near 6.5 percent, essentially unchanged for two years. AEI is projecting another 1 percent national decline by year-end 2026, with 2 percent drops in both 2027 and 2028.
The specific metros that led the 2020-2022 boom are now leading the downside. Austin doubled in average home price between Q4 2019 and Q2 2022 per AEI figures. Phoenix appreciated roughly 60 percent in the same window. Miami gained 50 percent. Dallas 64 percent. Las Vegas 45 percent. Each is now flipping direction. Rust Belt metros gained 25 to 33 percent in the same window, starting from lower bases. Those metros are now leading.
Why the Sun Belt Ran Hottest, and Cools Fastest
The 2020-2022 boom was powered by a specific combination of forces: pandemic-era migration out of high-cost coastal and Northeast metros, institutional build-to-rent capital flooding into specific Sun Belt cities, mortgage rates low enough to make speculative second-home purchases work, and insurance markets that had not yet repriced climate risk. Every one of those forces has changed direction.
Institutional capital has pulled back. Build-to-rent portfolios that were absorbing Sun Belt supply at premium cap rates in 2021 are now sellers or sidelined. The pandemic migration wave has stabilized, and moving-service data shows counter-migration back toward Rust Belt and Midwest metros. Mortgage rates at 6.5 percent do not make the second-home math work the way 3 percent rates did. Insurance carriers have finished repricing Sun Belt climate risk, which has not just raised premiums but in some cases removed availability entirely.
Rust Belt metros have the inverse conditions. Affordability. Stable insurance markets. Employment tied to the domestic manufacturing investment cycle, which the current tariff and reshoring policy regime is specifically supporting. Limited new supply, because the Rust Belt did not see the 2020-2022 construction boom that left the Sun Belt with overhang.
This is a structural regional repricing of conditions that have reversed. It is not random noise.
Florida’s Insurance Story Is Really Two Stories
Most retail coverage of Florida insurance treats it as one story. It is two.
- The first story is about premiums, and it is going the right direction. Florida’s SB 2A and HB 837 reforms, enacted in 2022 and 2023, are working on rate levels. Governor DeSantis announced on January 12 that Citizens Property Insurance will reduce statewide rates by 8.7 percent on average for spring 2026 renewals. Miami-Dade, Broward, and Palm Beach counties will see average reductions of 13.4 percent. Over 330,000 policyholders across all 67 counties will see rate decreases, with 150,000 receiving reductions of 10 percent or greater. 17 new insurance carriers have entered Florida since the reforms. The Florida Office of Insurance Regulation reports 73 rate-decrease filings and 94 zero-increase filings. Average annual homeowner premiums, including wind coverage, are now $3,815, up about 6 percent from a year ago but a sharp deceleration from the prior double-digit annual increases.
- The second story is about availability, and it is going the wrong direction. Premium reductions do not solve the deeper problem. In many coastal Florida zip codes, private flood insurance is simply unavailable at any price. The National Flood Insurance Program remains as a backstop, but with hard coverage limits of $250,000 on structure and $100,000 on contents. A Sarasota homeowner paying $2,400 per year in 2019 may now be paying $6,000 to $8,000 if they can get a policy at all. Some coastal beachfront and waterfront properties cannot obtain private flood insurance. A home that cannot be insured to a mortgage lender’s standard cannot be financed by a buyer with a mortgage. Cash buyers become the only buyers.
For a pre-retiree in Florida with a large share of net worth in home equity, the availability story matters more than the premium story. The premium story affects carrying cost. The availability story affects whether the asset can be sold at all. Those are fundamentally different problems.
Texas is not yet at Florida levels on the insurance crisis, but the trend line is heading the same direction. The Dallas Fed reported in April that Texas billion-dollar weather disasters grew from 8 in 2017 to 20 in 2024. Texas homeowner premium growth slowed from 18.7 percent in 2024 to 4.3 percent in 2025. That deceleration matters, but the underlying climate-risk repricing continues. Any retiree or pre-retiree in a concentrated Sun Belt market needs to verify not just the premium, but whether the policy renews at all given current roof age and flood zone.
Five Homeowners, Five Different Situations
The same AEI data produces five different correct actions, determined by where the reader sits.
- Mid-accumulation homeowner, no move planned within 5 years. Hold the house. One quarter of regional data is not a restructuring signal for a primary residence at this time horizon. The one discipline worth adding in 2026 is an actual agent-prepared comparative market analysis, not a Zillow or Redfin estimate. Transitioning markets lag on the automated estimators by 6 to 12 months, which is exactly when knowing the real number matters most. If homebuilder or REIT positions sit in the investment portfolio, check the regional concentration against the AEI divergence data.
- Pre-retirement homeowner within 5 years of retirement, Sun Belt primary residence. This is where the concentration analysis lives. Quantify home equity as a percentage of total net worth. Above 40 percent, the concentration is itself the risk, regardless of whether prices rise or fall. The move worth planning now is the downsize timing, mapped to the retirement income plan rather than to retirement year itself. Being forced to sell in year one of retirement at a depressed price damages a 30-year drawdown plan far more than any plausible investment-allocation mistake. The planning horizon on this is two to three years, not two to three months.
- Retiree already drawing on a plan that depends on the home. Most exposed reader. A drawdown plan that assumes a specific home sale in the next three years, at a price derived from 2022 comparables, is running on stale data. Stress-test the sale price assumption against actual current comparable sales in the specific zip code, not the metro average. If the insurance availability problem is live in the area, price that into the timeline, because a buyer using a mortgage depends on being able to insure the property at closing. A home that cannot be insured cannot be financed.
- Active investor with homebuilder, REIT, or regional bank equity. The regional divergence is directly actionable on the portfolio side even though it is not actionable on the primary residence. D.R. Horton, Lennar, and PulteGroup carry heavy Florida, Texas, and Arizona concentration and face different fundamentals than diversified or Midwest-weighted builders. Sun Belt-concentrated residential REITs face different fundamentals than the broader sector index. Regional bank exposure matters because construction lending and mortgage portfolios concentrate by geography, and the banks with heavy Sun Belt exposure are carrying the credit risk of the regional decline. This is a concentration-review signal, not a sector sell signal.
- Prospective buyer considering a Sun Belt metro. The question that matters is whether the property passes a 5-to-7-year hold test against another 15 percent decline. If the answer is yes, current softness is genuinely buying-friendly and the long-term math still works. If the answer is no, the discipline is to wait for at least two consecutive quarters of regional inventory decline before committing. The cost of being six months late to a recovery is smaller than the cost of catching a falling market with a mortgage attached.
Five Situations at a Glance
- Mid-accumulation, 5+ year hold: Hold the house. Add an annual agent CMA. Review homebuilder and REIT regional concentration.
- Within 5 years of retirement, Sun Belt: Quantify home equity as percent of net worth. Above 40 percent, concentration itself is the risk. Plan downsize timing 2-3 years out.
- Retired, drawdown depends on the home: Stress-test sale price against actual zip-code comparables. Insurance availability affects future sellability.
- Active investor holding builders, REITs, or regional banks: Review Sun Belt concentration in specific positions. Not a sector sell signal.
- Prospective Sun Belt buyer: Apply the 5-to-7-year hold test against another 15 percent decline. Wait for two consecutive quarters of regional inventory decline if you can’t hold through that.
The regional reversal is not random. It is structural. Why can some US metros build housing and others cannot? Why did the places that ran hottest during the 2020-2022 boom cool fastest?

Abundance by Ezra Klein and Derek Thompson, the #1 New York Times bestseller and Financial Times Business Book of the Year shortlist selection, makes the case that the metros winning the affordability competition are the ones that still know how to deliver supply. The authors write from a center-left frame, but the housing analysis cuts across partisan lines and gives you the structural explanation for why the map just flipped.
The Reversal is Real, But This Is Not 2008
A disciplined reader owes the counter-argument real consideration before acting on the data.
One quarter of regional housing data is not a restructuring signal for long-term holders. Over any 20-year rolling window, US residential real estate has produced positive real returns across essentially every major metro area. The 2008 pattern that some readers are mentally mapping onto 2026 required a credit-quality collapse that has no parallel in the current market. Current underwriting is tight. Forced-seller volume is minimal. Foreclosure starts remain near historic lows. This is a rate-driven affordability squeeze combined with regional overbuilding in specific Sun Belt metros, not a systemic credit-quality event.
AEI’s forward projection of further declines through 2028 may also prove wrong. Florida Trend reported on April 6 that early stabilization signs are appearing in some of the hardest-hit Florida metros. Punta Gorda and Cape Coral are now showing year-over-year inventory decreases, which is the leading indicator that precedes price stabilization. The intensity of the downturn appears to be easing in specific sub-markets even as the AEI headline numbers catch up to data that is three to four months old.
Reacting to one year of regional data with a portfolio-level restructuring repeats the behavioral error that produced the worst retail returns of the 2020 crash. For long-horizon homeowners, the disciplined response is to stay put, run a CMA once this year to know the actual number, and ignore the rest of the noise.
The Signals That Confirm an Acceleration
Defining what would confirm a regime shift before it arrives in the rearview mirror separates useful analysis from reactive commentary.
What would confirm the reversal is accelerating? Rising foreclosure starts in specific Sun Belt metros. Foreclosure volume currently remains near historic lows. A sustained uptick, particularly in Florida and Arizona, would signal the rate-driven squeeze is producing forced-seller pressure. That changes the calculation for pre-retirees, retirees, and prospective buyers simultaneously.
What single event would move the framework fastest? A major insurer announcing withdrawal from Florida or Texas. That is carrying-cost shock, not just price pressure, and it immediately affects sellability for current owners regardless of their situation.
What should homebuilder equity holders watch? Delivery-to-order ratios in Sun Belt-heavy builders. If backlogs collapse in Florida, Texas, and Arizona while Midwest and Rust Belt order books stay firm, the housing market reversal has rolled through the sector cycle, not just the resale market. The equity repricing usually arrives six to nine months after that confirmation.
What should prospective buyers watch? Two consecutive quarters of regional inventory decline in the specific target metro. One quarter of stabilization is a data point. Two is a pattern. Three is an entry signal.
What should concentrated Sun Belt homeowners watch in their own situation? The actual current market value of the home, verified through an agent CMA once every twelve months. The illiquidity of home equity is a behavioral asset until it becomes a blind spot. The retiree who does not check the number during a regional correction is the retiree who discovers too late that the drawdown plan no longer works.
Takeaways from the Housing Market Reversal
The map flipped. That is the fact.
Every tracked metro in three of the largest Sun Belt states is now declining. Every leading metro in the April data is a city that sat out the 2020-2022 boom. This housing market reversal is structural, not cyclical. But structural does not mean linear, and it does not mean fast. A regional repricing that took three years to build will not unwind in six months.
The mistake that does the most damage in situations like this is treating one quarter as signal when the reader’s time horizon is fifteen years, or treating it as noise when the reader is five years from retirement with half of net worth concentrated in a declining metro. The five-situation framework above exists precisely to separate those two readers, because the same data point carries different weight for each.
The work now is knowing which situation applies, running the CMA that produces the real number rather than the estimator lag, and watching the signals that would confirm an acceleration before the acceleration shows up in the trailing data.
Frequently Asked Questions
Is the US housing market crashing in 2026?
No, not in the 2008 sense. What is happening is a regional repricing where Sun Belt metros that led the 2020-2022 boom are declining, while Rust Belt and Midwest metros are gaining. AEI data through February shows 28 of 53 tracked metros down year-over-year, with national appreciation at 1.1 percent, the slowest rate since 2012. This is a rate-driven affordability squeeze combined with regional overbuilding, not a credit-quality collapse.
Why are Sun Belt home prices falling while Rust Belt prices rise?
The 2020-2022 boom in Sun Belt metros was driven by pandemic-era migration, institutional build-to-rent capital inflows, speculative buying at low mortgage rates, and insurance markets that had not yet repriced climate risk. Every one of those forces has reversed. The Rust Belt has the mirror image: affordability, stable insurance, manufacturing employment tied to domestic reshoring, and limited new supply. The regional divergence is structural, not random.
Should I sell my Florida home because of the housing market reversal?
For most owners with no immediate plans to move, no. One quarter of regional data is not a signal of a primary residence restructuring at a 5-plus-year hold. The exceptions are homeowners within five years of retirement with large net-worth concentration in the home, retirees whose drawdown plan depends on a specific home sale in the next three years, and owners in coastal zip codes facing insurance availability issues that affect future sellability.
Are homebuilder stocks a buy or sell on this reversal?
It depends on regional concentration. Sun Belt-heavy builders like D.R. Horton, Lennar, and PulteGroup face different fundamentals than diversified or Midwest-weighted alternatives. The housing market reversal is not a sector-wide sell signal. It is a concentration-review signal for specific positions, particularly those with heavy Florida, Texas, and Arizona exposure.