

QUICK SUMMARY: Small-cap stocks are outperforming mega-cap tech in 2026 as institutional investors rotate toward domestically focused companies trading at a 30-year valuation discount. The Russell 2000 forward P/E stands at 17.69x against the S&P 500’s 22x-plus multiple. This article covers whether the move is durable and what a rebalancing decision looks like across different investor timelines.
The rotation started before most retail investors noticed it. In the first two months of 2026, the Russell 2000 outperformed the S&P 500 for a record 15 consecutive trading sessions. Small-cap stocks, the category that strategists spent nine years calling the next big opportunity before being wrong, are finally delivering. And most portfolios built around the names that led the 2023-2025 bull market are positioned to miss it.
This is not a prediction. The fund flow data is already in. According to State Street, investors pulled approximately $12 billion from small-cap ETFs in the year leading into this rally, even as institutional desks were quietly rebalancing in the other direction. The retail investor moved last, as usual.
The question now is not whether the rotation happened. It is whether the thesis still holds.
Has the Small-Cap Stocks Rotation Already Happened, or Is the Best of It Still Ahead?
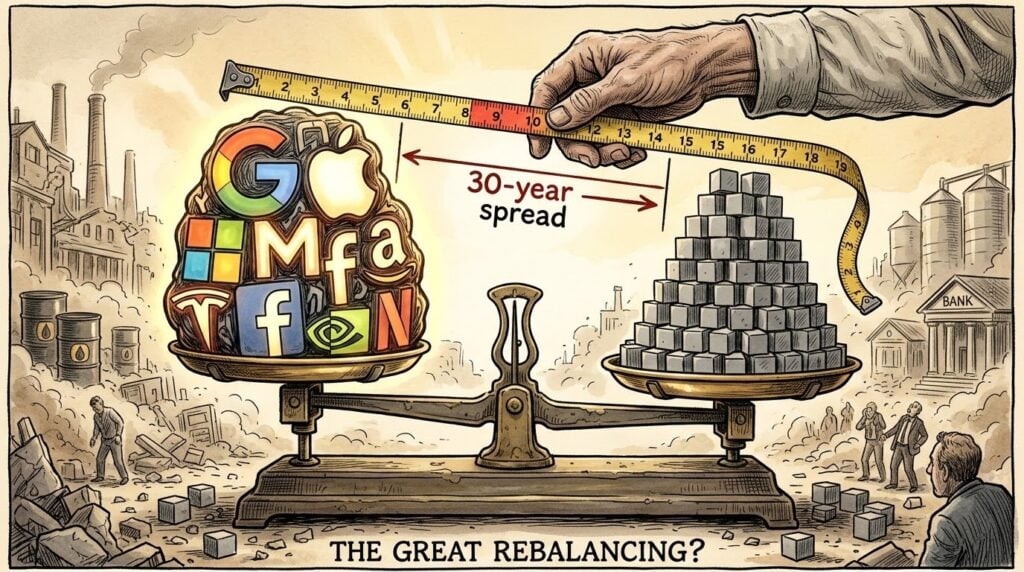
The Russell 2000 forward P/E sits at 17.69x against the S&P 500’s 22x-plus multiple — a spread near its 30-year extreme. The numbers behind the small-cap outperformance are not marginal. That gap represents the kind of valuation differential that historically produces multi-year regime shifts rather than single-quarter trades.
The earnings data reinforce the case. Roughly 65% of Russell 2000 components beat Q4 2025 earnings expectations, the best beat rate since 2021. Projected small-cap earnings growth for 2026 stands at 18.4% against 13.2% for large-caps, according to Jefferies equity strategy research. That is not a story about cheap stocks getting cheaper. It is a story about cheap stocks growing faster while most retail money was watching somewhere else.
Why Are Institutional Investors Rotating Into Small-Cap Stocks Right Now?
Three structural factors are driving the rotation, and none of them reverse quickly.
The first is the valuation gap. The S&P 500’s concentration in mega-cap technology names inflated its price-to-earnings multiple to levels where much of the next several years of growth was already priced in. At forward P/E multiples ranging from 24x to 66x across the largest tech names, a company does not need to disappoint to underperform. It only needs to grow slower than the market expects. Small-cap stocks entered 2026 at a discount to large-caps not seen in nearly three decades.
The second is domestic revenue exposure. Small-cap companies derive roughly 70 to 80% of their revenue inside the United States. In a tariff environment where international supply chain complexity has become a real portfolio risk, that domestic concentration is structural insulation. The companies supplying cooling systems for data centers, pumping equipment for infrastructure projects, and banking services for regional businesses are not particularly vulnerable to the next round of trade negotiations.
The third is earnings acceleration. The AI capital expenditure cycle that drove extraordinary growth among the Magnificent Seven is maturing. Investors are now demanding actual returns on AI spending rather than growth narratives. Meanwhile, 100% bonus depreciation for domestic manufacturing under recent legislation is channeling capital into exactly the kind of industrial and regional financial small-caps currently leading the rotation.
Is IWM or IJR the Better Vehicle for Small-Cap Exposure?
Roughly 40% of IWM holdings are currently unprofitable, making IJR’s profitability screen the more defensible vehicle for long-term investors. Here is the part of the rotation story that gets glossed over. The iShares Russell 2000 ETF holds nearly 2,000 companies with no earnings requirement. The small-cap opportunity is not the index in its entirety. It is the disciplined slice of the index where earnings are real and balance sheets are not dependent on perpetually cheap credit to stay solvent.
The iShares Core S&P Small Cap ETF, ticker IJR, applies a profitability screen before including any holding. It carries an expense ratio of 0.06% against IWM’s 0.19%, and it has historically delivered comparable or better risk-adjusted returns by filtering out the weakest portion of the small-cap universe. For long-term investors making a deliberate allocation decision, IJR is the more defensible vehicle. For active traders who need options depth and benchmark-tracking liquidity, IWM remains the standard.
Sector leadership within the rotation has concentrated in industrials, driven by domestic manufacturing demand and infrastructure spending, and regional financials, which benefit from a steepening yield curve. These are businesses with earnings, identifiable revenue drivers, and in several cases dividend histories that predate the current AI cycle entirely.
Investors ready to add small-cap exposure can access IWM and IJR through major brokerages. For guidance on building a consistent allocation strategy using data-driven principles, “Just Keep Buying” by Nick Maggiulli is a rigorous treatment of why automated, process-driven investing outperforms timing-based approaches. Available through our educational partner link below.

What Is the Strongest Argument Against the Small-Cap Stocks Trade?
The other side of this argument deserves space. It is not wrong.
Small-cap outperformance has been called prematurely for nine consecutive years. Investors who rotated out of mega-cap tech in 2022, 2023, or 2024 paid a real opportunity cost as large-cap AI names compounded above 30% annually. Stephen DeSanctis, equity strategist at Jefferies, framed the concern plainly in a recent strategy note: the worry is whether this turnaround proves to be “a one hit wonder” rather than a sustained regime change.
The specific mechanism for failure is rate policy. Small-cap borrowing costs are more sensitive to interest rates than those of mega-cap companies with access to global capital markets at scale. If the Federal Reserve accelerates rate cuts faster than current market pricing implies, the borrowing cost disadvantage that currently weighs on capital-heavy mega-cap balance sheets shrinks. That removes one of the structural tailwinds working in small-cap’s favor today.
The Russell 2000’s 30-year valuation discount improves the probability of outperformance over a multi-year horizon — it does not eliminate the risk of underperformance in any given 12-month window. A spread at historic extremes is a signal, not a guarantee.
How Much Should You Realistically Allocate to Small-Cap Stocks Based on Your Timeline?
The right allocation depends on where you are in the investment cycle, not just what the market is doing this month.
For investors in a long accumulation phase with a 10-plus year horizon, the most defensible move is to set a target small-cap allocation, somewhere in the 15 to 20% of equity range, and automate monthly contributions into IJR or IWM. Remove the timing decision from the execution layer entirely. The data consistently shows that investors who automate contributions outperform those who wait for the perfect entry point. The rotation is real, but trying to identify its floor is the wrong frame for a long-term accumulation strategy.
- For investors with a 5 to 10 year horizon who are currently more than 50% concentrated in cap-weighted S&P 500 funds, the valuation spread justifies a deliberate rebalancing tilt. Not a wholesale rotation. Moving 10 to 15 percentage points of equity exposure from a cap-weighted S&P 500 fund toward IJR is a defensible, data-supported position given the current environment.
- Investors already holding VTI carry roughly 10 to 12% small-cap exposure by market weight; a deliberate allocation to IJR or IWM beyond that is a valuation-based decision, not a structural requirement.
- For investors within five years of their first retirement withdrawal, run an honest drawdown tolerance check before adding small-cap volatility. Small-cap stocks experience drawdowns of 35 to 40% in stress scenarios with regularity. Adding that volatility in the sequence-of-returns danger zone is a structural risk the valuation case does not offset. [INTERNAL LINK: sequence of returns risk — escalate to editorial per standing protocol]
If you want to go deeper on the data behind automated, consistent investing as the framework for long-term accumulation, “Just Keep Buying” by Nick Maggiulli is the most rigorous treatment of why removing timing from the equation outperforms nearly every alternative. Available through our educational partner link above.
For educational purposes only. Not financial advice. Consult a licensed financial professional before making investment decisions.
Frequently Asked Questions
What Are Small-Cap Stocks and Why Do They Matter for Your Portfolio?
Small cap stocks are shares of companies with market capitalizations typically between $300 million and $2 billion. They tend to be more domestically focused, more sensitive to interest rates, and more volatile than large-cap peers. The Russell 2000 Index is the primary benchmark for US small-cap performance, tracked by ETFs including IWM and IJR.
What Is the Difference Between IWM and IJR for Small-Cap Exposure?
IWM tracks the Russell 2000 with no profitability screen — roughly 40% of holdings are currently unprofitable. IJR tracks the S&P Small Cap 600, screens for profitability before inclusion, and carries an expense ratio of 0.06% versus IWM’s 0.19%. IJR suits long-term buy-and-hold investors. IWM suits active traders who need liquidity and options market depth.
How Much of My Portfolio Should Be in Small-Cap Stocks?
A reasonable target for most equity portfolios is 15 to 20% of equity. Investors holding VTI already carry roughly 10 to 12% small-cap exposure by market weight. Any allocation beyond that is a valuation-based decision rather than a structural requirement, and should be sized to what you can hold through a 30 to 40% drawdown without changing strategy.
Is the Small-Cap Rotation Likely to Continue or Has the Move Already Happened?
The structural underpinnings of the current rotation are more durable than prior false starts: earnings growth outpacing large-caps, a valuation gap near 30-year extremes, and domestic revenue insulation in a tariff environment. The primary risk is an accelerated Fed rate cut cycle reducing the borrowing cost penalty on mega-cap tech. Monitor Fed rate language before sizing up any new position.