

Posted on | Options Trading Strategies
There are many “short hand” methods of gauging the market view of average investors at any given moment. One of the simplest of these “short hand” analytical tools is to review yearly and monthly “Funds Flows”[1] within ETFs. According to data from Bloomberg, flows into equity ETFs during 2014 were quite strong, which is hardly surprising given equities’ positive performance during the year.
What might seem surprising, however, is that eight of the top spots within 2014’s list of “Top Ten ETF Inflows” were equity-based ETFs. By way of comparison, in former years there was a broader mix of top asset gatherers.
This dominance by equity ETFs during 2014 does not mean that fixed income ETFs were neglected. In fact, funds flows into fixed income ETFs during 2014 were so strong that they set a new record for the bond ETF space!
However, investing in bonds during 2014 was not for the faint of heart. During late January’s bigETF.com Conference that drew almost 2,000 financial industry professionals and investors toHollywood, Florida, one of the most vocal and heartfelt topics of conversation (including some handwringing) was a “Monday Morning Analysis” regarding why the bond market acted as it did during 2014. The fact is that the key dynamic that most impacted U.S. bonds in 2014 was what I refer to as the “Head Scratching Syndrome”!!
Here is why I describe the 2014 bond space in that way:
1) For the past three to four years, most of the financial advisors from whom I heard have warned of the danger lurking in bonds because (some variation upon the following:) “Historically low interest rates are extremely vulnerable to a rise in rates, which inevitably leads to lower bond prices.” During each of those years, such advisors looked like the “Boy Who Cried Wolf”.

2) Especially as we approached the beginning of 2014 (following the 2013 mid-year swoon in equity and bond prices following Ben Bernanke’s “Taper Tantrum”… Wall Street Analysts were fairly unanimous that higher U.S rates (and lower prices) were imminent. Hence, they warned all buyers of bonds that they should “Beware!”[2]
3) What was the “Result?”
a) At the end of 2013/beginning of 2014, U.S. 10-year Treasury Notes yielded close to3 percent.
b) By the end of 2014, the 10-year had fallen to a 1.8% yield!
c) As a result, the hate mail and vitriolic voice messages left for financial advisors escalated considerably during 2014!
d) A growing lack of faith in the efficacy of investment counsel from Wall Street has prompted a growing number of investors to seek out “new” sources of guidance regarding investment ideas and asset allocation… including the proliferation of “Robo Advisors” who offer model asset allocation portfolios which include “built in” automated rebalancing and tax loss harvesting!! [3]
At that Hollywood, Florida conference, the Chief Investment Officer at ETF.com, David Nadig, offered this observation: “There’s a lack of understanding about what the hell happened last year.”
Building on this theme of Wall Street “confusion”, Jeffrey Gundlach[4] pointed this out: “Last year was one of the best years ever for 30-year bonds. Now, a lot of investors are afraid not to own Treasuries because they performed so well.” Of course, there are twin dangers contained within the truth of that observation:
1) Longer-term bonds are the ones that carry the highest interest rate risk;
2) One should never assume that “past results are in any way indicative of future performance.”
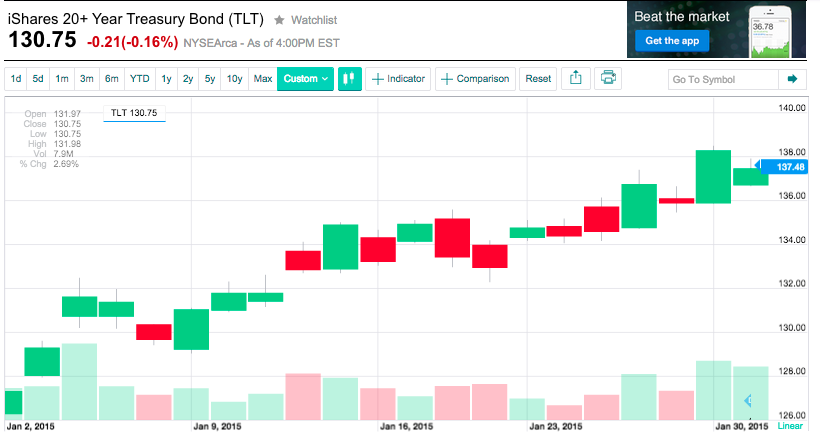
It appears that 2015 will be no easier an environment within which to invest! Just take a look at the performance of the iShares 20+ Year Treasury Bond (TLT) during January… as the U.S. exhibited positive growth in production and earnings while most of the rest of the world was struggling with sluggish growth … including widespread fear of deflation! Combine that with ongoing strength within the U.S. Dollar and a combination of weakness and volatility within U.S. equity markets and (as you see below) TLT looked like a prime thoroughbred horse rounding the curve at the Derby, anxious to win the race! (its candlesticks took a path straight upward!).
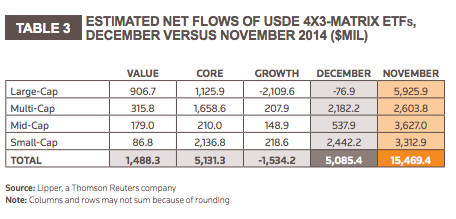
That was the backdrop within which investors pulled almost $16 billion from U.S. Equity ETFs during January (2015) while (seemingly) piling into bonds. In fact, if investor interest in bonds between this month (February) and this coming December averages out to be approximately the same per month as was invested bonds during January, then 2015 will see $41 billion morefunds flowing into bonds than that asset class attracted during all of 2014!!
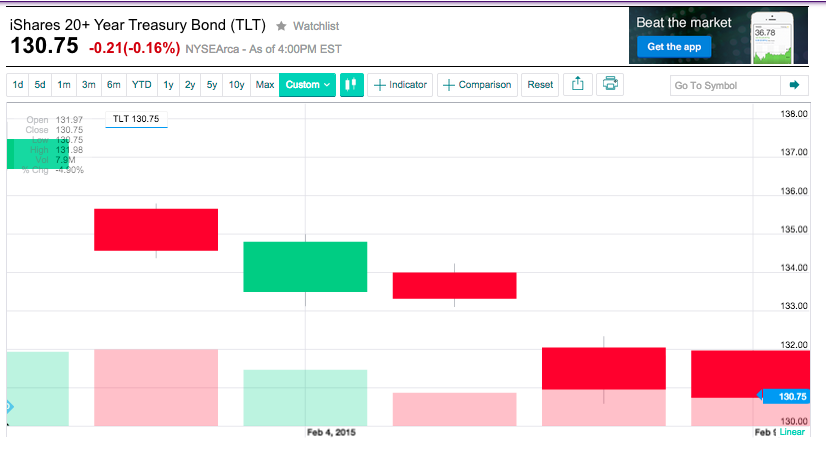
But as February started, there was just one problem — severe skittishness among investors because the bond market has not been acting “normally” for a long, long time! All it took to put the skids on bond enthusiasm was the February 6th labor report from the notoriously unreliable U.S. Bureau of Labor Statistics … combined with more news regarding how the new Greek government was handling (or not) the servicing of that country’s debt load. Here is what TLT has done so far in February (through February 9th):
Consider these ironies:
1) Yes, the Nonfarm Payroll numbers for January were a big surprise on the upside! However, this data from the BLS comes from the very same folks who somehow misplaced147,000 workers in November and December (the number of workers added through prior month revisions to the November and December NFP reports!);
2) Since the Financial Crisis began, the U.S. Markets have (upon several occasions) been held hostage (so to speak) by news regarding how Eurozone leaders (and more significantly, Euro banks) were handling Greece’s struggles in servicing their outsized debt[5].
With all this attention focused upon Greece, one might think that its debt (relative to Euro debt as a whole) was astronomical. But consider this – what U.S. economic region could be considered equivalent to Greece relative to its GDP? California, perhaps? Not even close. Illinois? No! Connecticut? Absolutely not!
Instead, the apt parallel with regard to Greek GDP is the Dallas/Fort Worth area of Texas! Keep that in mind the next time you see that news from Greece is shaking up the investment markets in the U.S.[6]
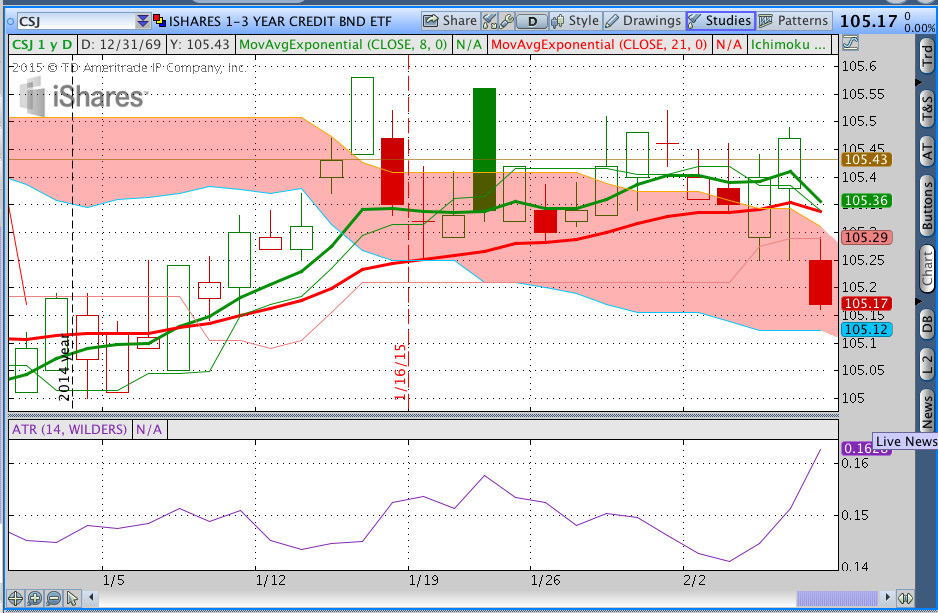
Showing how jittery the market was on the day of the January Nonfarm Payroll Report, take a look at this graph of iShares Barclays 1-3 Year Credit Bond Fund (CSJ). As its name implies, CSJ sits well toward the conservative side of fixed income risk, and yet the candle on February 6th gapped down at the open and never significantly recovered. The measured move on that day was over 15% greater than normal… which is high for short-term bonds.
Reflecting this skittishness, is the fact that on a 2015 year-to-date basis, five of the top ten highest ETF fund flows have been into bond funds – with the leader being one fund even more conservative than CSJ. That leading ETF was the iShares Short Treasury Bond ETF (SHV). During this period, $2.5 billion was drawn into SHV — with $2 billion of those funds arriving on a single day!
Getting to the Point:
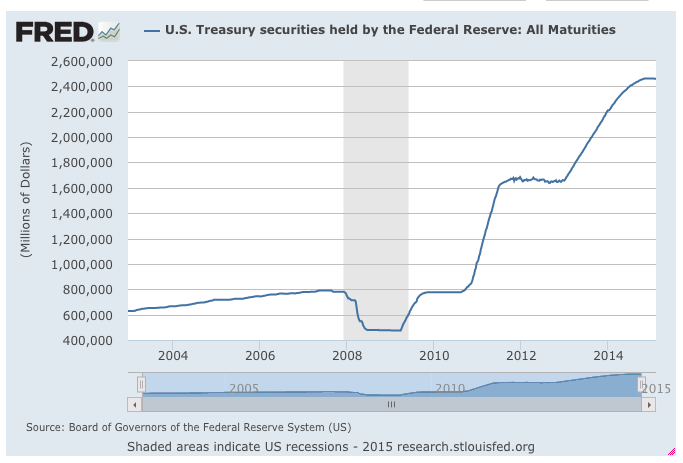
What has caused this enigmatic behavior within the fixed income universe? The following graph can not account for all of the factors that have made fixed income investing much more complicated these days… but it absolutely illustrates the single most significant factor which has “rocked” the fixed income world (and the investing universe in general):
Consider these graphs that breakdown ownership of U.S. Treasury Securities as of the Third Quarter of 2012:
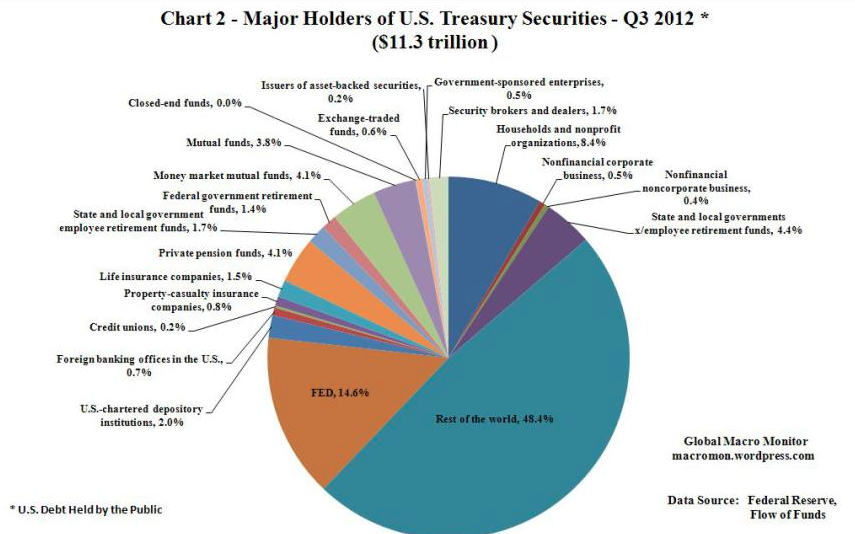
The U.S. Federal Reserve then held 14.6% of U.S. Treasury Debt. A significant amount to be sure. However, between then and 2014, the FED increased its holdings by (an amazing) 47%!! Performing the precise math with regard to the percent the FED held by 2014 is beyond the scope of my analysis here… but a “back of the envelope” calculation puts its percentage owned by 2014 atalmost 21.5%!!
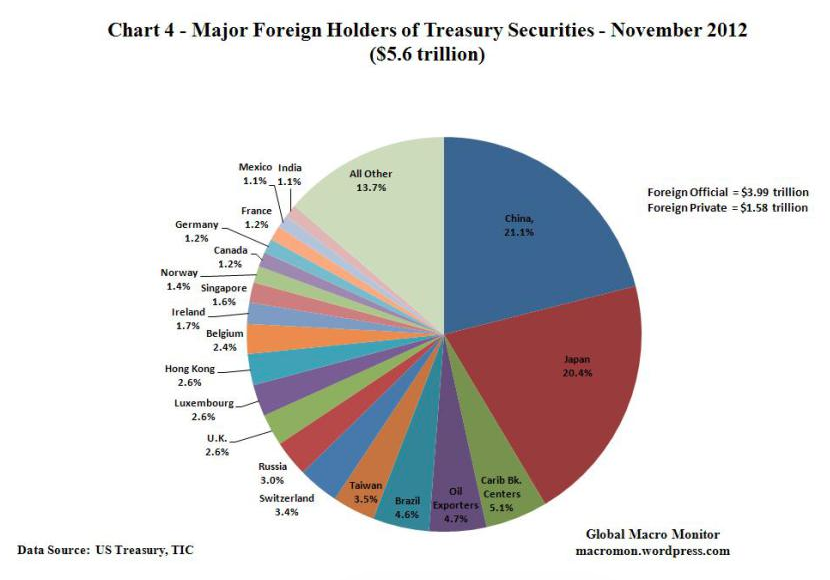
Through the years, we have all heard the repeated refrain that our mounting U.S. Federal Debthas made us “beholden” to major foreign holders of our debt – primarily Japan and China (see graph below). There is no denying that entities across the globe have been heavily invested in our bonds. However, given that aggregate foreign holders accounted for over 48% of U.S. debt in 2012… and China held 21% of those foreign holdings (ie. 10% of U.S. Debt in 2012), while Japan held 20% (ie. 9.6%) … the FED now dwarfs both countries vis-à-vis U.S. Debt.
It can be said that the FED became the “Elephant in the Room” regarding the trading/pricing of U.S. Treasury Debt!
Some of you might think – “Hey, that’s OK. After all, it is natural for the U.S. central bank to hold U.S. Treasury Debt!!”
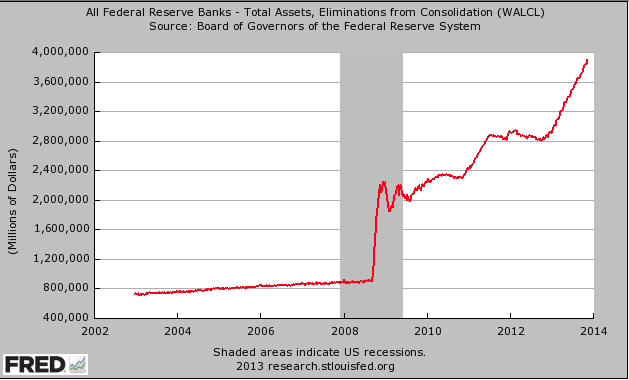
But this is the key point: What is entirely “Unnatural” about the above is that the FED bulked up its Balance Sheet by a factor of four between 2007 and 2014 in order to purchase most of that debt! The FED accomplished this through its several “Quantitative Easing” programs (QE I, QE II, QE III).
So I ask you:
1) Given these dislocations and artificial mega doses of sovereign-sourced liquidity “sloshing” around within global economies and marketplaces; and
2) Given that those forces have conspired to make the normally more predictable, more reliable bond market both less reward (rate wise) and more risky (volatility wise).
Where can investors find a “haven”[7] for their investable funds?
Alas, that has become the perplexing, “$64 Million Question” within the global investing universe? Since the world we live in carries U.S. interest rates that are much lower than anyone could have predicted as recently as 2-3 years ago … a world in which West Texas Intermediate Crude Oil sank lower than most would have guessed as recently as 2-3 years ago… a world within which the U.S. Dollar has risen further (and Gold priced in dollars has fallen further) than anyone would have imagined 3-4 years ago… precisely where should we invest our own personal capital?
Confirming the dilemma we face — a number of major investment concerns have warned that we are in a much more challenging investment environment than we have been since 2010! For example, the chief economist at Vanguard Group[8] (Joe Davis) [Vanguard is a mega-giant mutual fund and ETF vendor] recently offered this warning: “[we have] the most guarded outlook for markets since 2006. It’s going to be challenging going forward.”
Specifically, Vanguard projects that a “generic basket of stocks and bonds” will return less than 6% during the course of the next five years! That is done from the average return since 1926 (8.7%) and the return generated in 2014 (7.3%).
INVESTOR TAKEAWAY:
In days (long) gone by, one could invest in U.S. Treasury Bonds and as long as those bonds were held over a 3-7 year period, the average return received was relatively stable and dependable. In 2014, rates were so low that investors were pushed to stretch their normal, comfortable “risk tolerance” profile in order to garner reasonable returns. The unfortunate result was that many investors became unsuspecting victims of volatility levels higher than projected … and therefore returns that can hardly be categorized as either “stable” or “dependable”.
In our next article, we will explore some logical reasons for fixed income volatility… moving beyondjust the U.S. Federal Reserve’s several “QE” programs to explore the implications of bond guruBill Gross having been so utterly wrong regarding his 2011 prediction (and warning) regardingU.S. Treasury Securities … as well as how a bold (but arcane) fixed income trade made in London by Bruno Iksil rattled the markets, made Jamie Dimon suffer through innumerable headaches and sleepless nights, and will be remembered (forever) as ignominious within the annals of “trades gone bad”!
Following that purview, we will offer some real life options that investors can consider if they are interested in reviewing fixed income returns vis-à-vis various levels of risk.
DISCLOSURE:
The author currently holds an iron condor position within TLT… as well as a wide range of fixed income funds and ETFs that have not been mentioned in the text above. Nothing in this article is intended as a recommendation to buy or sell anything. Always consult with your financial advisor regarding changes in your portfolio – either subtractions or additions.
FOOTNOTES:
[1] “Funds Flows” is simply the measurement of investor funds into and out of each ETF. Over the course of a month, a quarter, or a year, a review of “NET” flows (inflows minus outflows) can serve as a barometer of market sentiment regarding equities vs. fixed income, U.S. equities vs. global equities, US Treasury bonds vs. corporate bonds, etc. Flows can also suggest market opinion regarding particular sectors within the equity space.
[2] Recall that international financial giant USB issued a blanket warning to their clients who held or purchased bonds that interest rate risk had heightened considerably (the investment world equivalent to the Surgeon General’s warning on cigarette packs).
[3] At least them, if the investment decisions are wrong, you can “kick” the computer or an algorithm!
[4] Gundlach has grown in stature to become almost a “twin” of Bill Gross in terms of the frequency with which his quotes about bonds appear in the financial press. He runs DoubleLine Capital LP.
[5] A debt accumulated over a number of years as the result of what many German leaders and a high number of financial experts consider to have been profligate governmental spending.
[6] Yes, I know that Greece is currently serving as a “totem” for all of the debt issues tied to thePIIGS (Portugal, Spain, Italy, Ireland, Greece, and Spain). So although Greece is the “smallest” component of that mix… what the EuroZone does to resolve Greece’s debt will set a precedent, for good or ill, for the rest. Let it be noted, as well, that Ireland has made great progress in bringing its debt load into manageable condition.
[7] NOTE: I did not use the adjective “safe” before haven!
[8] The second largest asset manager, following BlackRock Capital (number one).