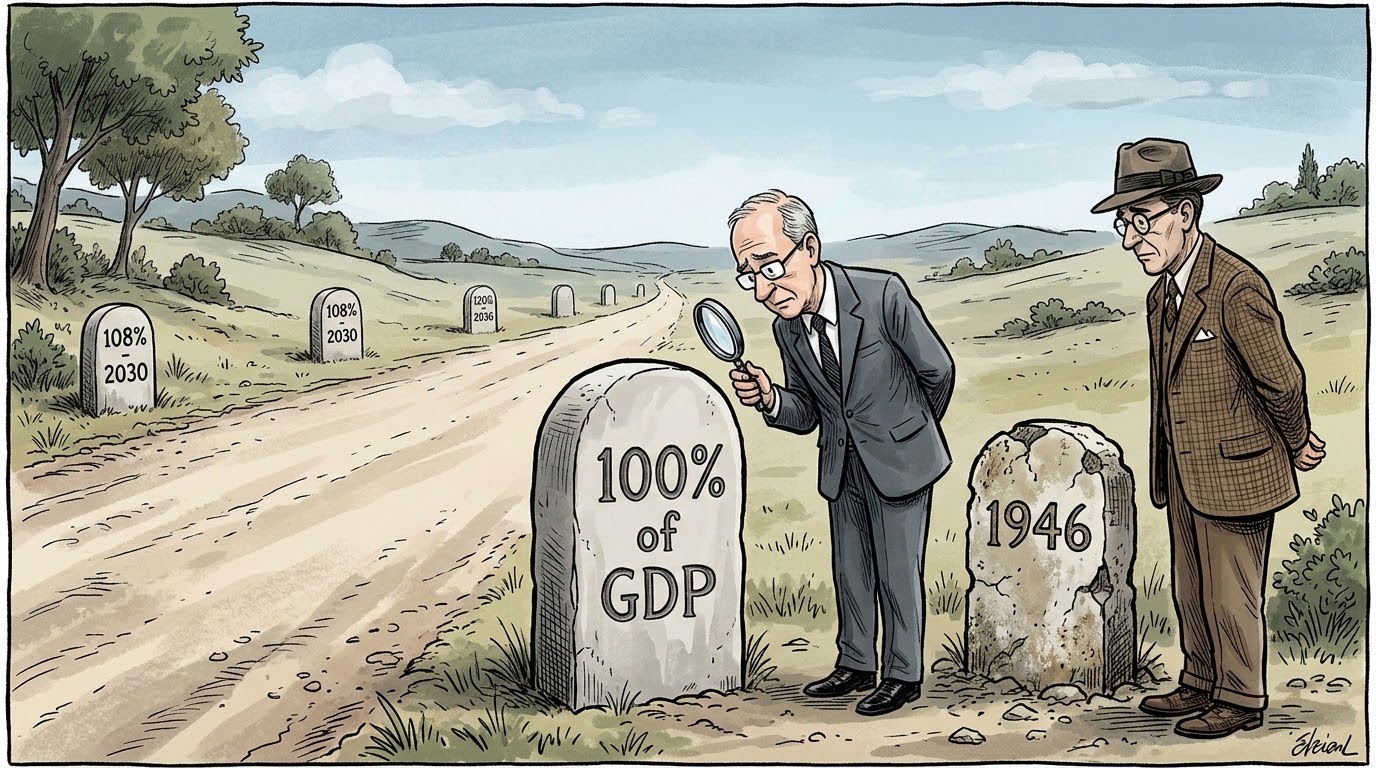

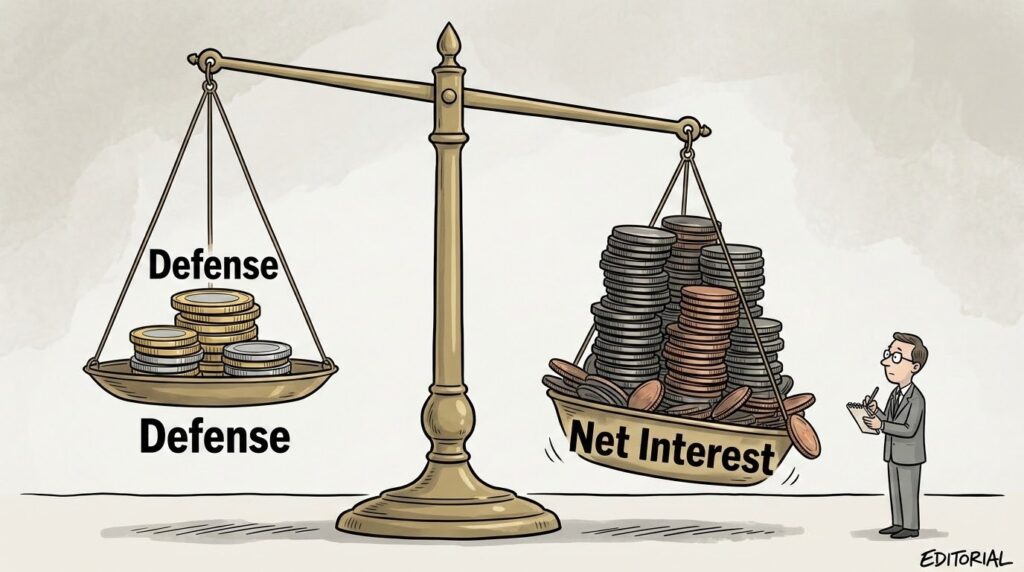
QUICK SUMMARY: US debt held by the public crossed 100 percent of gross domestic product at the end of March, the first time since 1946. Total US debt sits above $39 trillion. Net interest now exceeds the defense budget. Most coverage relies on the postwar comparison to make the milestone feel familiar. However, the arithmetic underneath the two periods does not match.
US debt held by the public crossed the 100 percent of GDP threshold based on first-quarter data the Bureau of Economic Analysis released on April 30. Debt held by the public was $31.27 trillion as of March 31, against an estimated nominal GDP of $31.22 trillion for the prior twelve months. The Committee for a Responsible Federal Budget marked the ratio at 100.2 percent in a statement last Thursday. Total US debt, including intragovernmental obligations, is above $39 trillion, or roughly $114,000 per American.
The last time the ratio exceeded 100 percent was 1946. It peaked near 106 percent that year, then fell for the next three decades, reaching about 30 percent by the early 1970s.
That precedent is doing most of the work in how the milestone is being framed. If the country crossed this line before and grew out of it, the implication is that it can do so again. The arithmetic of the two periods is what makes that implication unstable.
How the US Paid Down Its 1946 Debt
Three forces pulled the postwar ratio lower.
The first was growth. Real US GDP roughly doubled between 1946 and 1973. A larger denominator shrinks the ratio even when the numerator stays flat.
The second was inflation. The dollar lost a meaningful share of its purchasing power across the same window. Inflation reduces the real value of debt issued at fixed rates, which is why economists describe sustained inflation as a transfer from creditors to debtors. The federal government was the largest debtor in the country.
The third was demographics. The labor force expanded as the postwar generation entered working age. More workers paying into the tax base meant rising federal revenue without rising tax rates.
Spending discipline was a contributor but not the dominant one. Defense outlays fell sharply after demobilization. Mandatory spending on entitlements, the line item that drives most of the current trajectory, did not yet exist at scale. Medicare and Medicaid were enacted in 1965. Social Security existed but was a fraction of its current size.
The 1946 drawdown was, in mechanical terms, a story about a denominator that grew faster than the numerator, with help from inflation that reduced the real burden of fixed-rate obligations.
What Makes US Debt Different in 2026
The numerator side of the ratio is now driven by structural commitments rather than wartime spending. Mandatory programs run on autopilot under existing law. According to a No Labels analysis published this week through Fortune, only 27 percent of federal spending is discretionary. The remaining 73 percent, which includes Medicare, Medicaid, Social Security, and interest payments, grows automatically regardless of congressional action.
Net interest is the line that has changed the most. Interest on debt held by the public was about $500 billion in fiscal 2022. It reached approximately $1 trillion in fiscal 2025 and has surpassed $1 trillion in fiscal 2026, according to data from Third Way. That figure is now larger than annual defense spending and trails only Medicare and Social Security among federal outlays.
The Congressional Budget Office’s February 2026 baseline projects debt held by the public at 108 percent of GDP by 2030 and 120 percent by 2036. The 2056 projection is 175 percent. Those projections incorporate the One Big Beautiful Bill Act and current tariff policy.
The denominator side does not have the same tailwinds it had after 1946. The labor force is aging rather than expanding. The Social Security trustees and the CBO both project that the worker-to-beneficiary ratio will continue declining through the 2030s, which compresses the revenue side of the equation. Sustained high-inflation policy is constrained by the Federal Reserve’s dual mandate in a way it was not in the late 1940s, when the Fed was operating under a Treasury Accord that explicitly capped yields to support war financing.
The mechanism that drew the 1946 ratio down, which was real growth outpacing debt accumulation while inflation eroded the real value of fixed-rate obligations, has fewer of its parts available now.
The Compounding Loop in Net Interest
The most consequential difference between the two periods is structural rather than political. Net interest cost is now self-reinforcing.
When the federal government runs a deficit, it issues Treasury debt to cover the gap. When the average interest rate on outstanding debt rises, the cost of servicing that debt rises with it. That higher servicing cost adds to the deficit, which requires additional issuance, which adds to the outstanding debt. Each turn of the cycle is larger than the last unless either the deficit narrows enough to offset the interest cost or rates fall enough to reduce it.
According to a Third Way analysis published in December, each additional percentage point in the debt-to-GDP ratio raises long-term interest rates by an estimated 1.5 to 4.7 basis points. The relationship is gradual at low ratios and steepens as the ratio rises. The CBO projects net interest reaching 4.4 percent of GDP by 2035, compared to 3.2 percent in fiscal 2025.
Henry Paulson, the former Treasury secretary under George W. Bush, addressed this dynamic in a Bloomberg interview on April 17. He said the country’s debt trajectory could push investors to demand higher yields on Treasuries, which would force interest rates higher, which would make the deficit harder to close. Should investor demand weaken sufficiently, he said, the Federal Reserve would face pressure to step in as a buyer of last resort. He described the eventual repricing as something the country needs to prepare for rather than predict.
The structural point is that net interest does not respond to congressional negotiation. Discretionary spending can be cut. Mandatory programs can be reformed, though the political cost is high. Interest payments are contractual. The federal government must pay them.
Will Treasury Markets Keep Absorbing New US Debt Issuance?
The 1946 debt was financed largely by domestic investors and by Federal Reserve policy that supported wartime issuance directly. The 2026 debt sits in a more diffuse market. Foreign holders, primary dealers, the Federal Reserve, US banks, money market funds, pension funds, and individual investors all hold portions of the outstanding stock.
The question that did not exist in 1946 is whether existing buyers will continue to absorb new issuance at prevailing yields.
Wolfstreet’s analysis of fiscal 2026 issuance shows the Treasury Department added $940 billion in debt held by the public over the five months following the July 2025 debt ceiling increase. That was the additional supply bond market investors had to absorb during that window. The Treasury anticipates issuing $574 billion in net marketable Treasury debt in the first quarter of 2026 alone.
The institutional buyer base has also shifted. Foreign holdings of Treasuries have grown in absolute terms but declined as a share of outstanding debt. The Federal Reserve’s holdings sit near $6.2 trillion, down from a peak of $8.5 trillion in 2022, as the Fed has allowed bonds to mature without full replacement. Nigel Green, CEO of deVere Group, characterized the situation in a March commentary: there is a tendency to treat US debt as permanently manageable because the market is large and the dollar remains dominant.
The mechanical question is straightforward. If the existing buyer base does not absorb new issuance at current yields, yields rise to attract new buyers. Higher yields raise the federal government’s interest cost. The compounding loop tightens.
The Counter-Position: No Big Deal
The opposing view is well-established and worth stating accurately, because it has been the historically dominant strategy.
The argument runs that the US has carried elevated debt before without producing the consequences debt hawks have predicted. Markets have priced sustained deficit spending without demanding sharp yield repricing. The dollar has retained reserve currency status. Treasury auctions have continued to clear. A long-running Bogleheads forum thread on national debt and investing captures the position directly: “Didn’t care when it hit 20 trillion. Didn’t care when it hit 30 trillion. Won’t care when it soon hits 40 trillion.”
The S&P 500 has compounded through every prior fiscal milestone the country has crossed, including the 1946 peak. Investors who reduced equity exposure on debt-driven concerns over the past 40 years generally underperformed those who held positions through the noise.
The honest tension is that both observations are true at the same time. The historical pattern has been resilience. The trajectory described by the CBO is outside the range the historical pattern was generated under. The first observation supports holding course. The second observation is what those who have changed positioning are responding to.
The Bogleheads forum has carried this exact tension repeatedly through 2025 and into 2026. One forum member wrote that they were “finding it harder to ‘stay the course’ without questioning if this portfolio truly hedges against a potential domestic fiscal crisis.” Another wrote that they wanted to make sure “the ‘set it and forget it’ mentality isn’t blinding me to a fundamental shift in U.S. fiscal reality.” These are not panic responses. They are open questions from long-term passive investors testing their own framework against current data.
Investors testing their framework against current data is the recurring move underneath every fiscal milestone the country has crossed. Same as Ever by Morgan Housel is one of our informational picks on how seasoned investors think through events that fall outside the historical pattern they were trained on.

What the Milestone Actually Is
The 100 percent crossing is not, by itself, a market event. Treasury auctions on April 30 cleared. Equities did not reprice on the announcement. The dollar held its range. In the short term, the milestone is a reporting threshold rather than a forcing function.
What the milestone changes is the analytical frame. A debt-to-GDP ratio above 100 percent is not unprecedented in US history. A debt-to-GDP ratio above 100 percent without a war to end, without a postwar growth tailwind, with mandatory spending on autopilot, with net interest as the third-largest line in the federal budget, and with the CBO projecting the ratio rising for the next three decades, is unprecedented.
The 1946 comparison is the comparison most coverage is reaching for because it is the only direct precedent in modern US history. The arithmetic of the two periods does not support the implication that historical precedent applies. That is the analytical content of the milestone.
The market’s reaction over the next several quarters will provide more information than the milestone itself does. The questions to watch are concrete. Whether Treasury auctions continue to clear at current yields. Whether the term premium on long-duration Treasuries widens further. Whether foreign holders continue to add to their positions or trim them. Whether the dollar’s trade-weighted index holds its range against major trading partners. Whether the CBO’s 2030 projection of 108 percent gets revised higher in subsequent baselines. These are the indicators that translate the US debt milestone into something the market is pricing rather than something the watchdog groups are reporting.
For educational purposes only. Not financial advice.
Frequently Asked Questions
Has US debt ever been higher than GDP before?
Yes, briefly. Debt held by the public peaked near 106 percent of GDP in 1946 after World War II, then declined to about 30 percent by the early 1970s. The 100.2 percent reading at the end of March is the first time the ratio has crossed 100 percent since the postwar peak.
What is the difference between debt held by the public and the $39 trillion figure?
The 100 percent milestone refers to debt held by the public, which was $31.27 trillion as of March 31. The $39 trillion figure includes intragovernmental debt, which is money the federal government owes itself, primarily through the Social Security Trust Fund and federal employee retirement accounts. Debt held by the public is the figure economists use to assess the country’s external borrowing position.
Why is net interest now larger than defense spending?
Two factors. The outstanding stock of debt has grown, and the average interest rate on that debt has risen as older low-rate issuance is refinanced at higher current yields. According to Third Way, net interest was about $500 billion in fiscal 2022 and reached approximately $1 trillion in fiscal 2025. Defense spending in fiscal 2025 was $917 billion.
What is the One Big Beautiful Bill Act’s impact on US debt?
The CBO’s February 2026 baseline incorporates the One Big Beautiful Bill Act and projects debt held by the public reaching 108 percent of GDP by 2030 and 120 percent by 2036. The CBO has identified the Act, along with higher tariff rates and lower immigration projections, as the primary drivers of the trajectory revision from prior baselines.
What does the Congressional Budget Office project for the next decade?
The CBO’s February 2026 baseline projects debt held by the public reaching 108 percent of GDP by 2030 and 120 percent by 2036. The 2056 projection is 175 percent.
How does the US compare to other countries with high debt-to-GDP ratios?
Several developed economies operate above 100 percent of GDP. Japan’s ratio is above 200 percent. The structural difference is that Japan finances most of its debt domestically through its own central bank and savers, while the US relies more heavily on foreign holders and a globally distributed buyer base. The comparison is sometimes used to argue that the US has room to run. The countervailing observation is that Japan has carried a low-growth, near-zero-rate economy for much of the period during which its ratio has been elevated.